Fig. 1
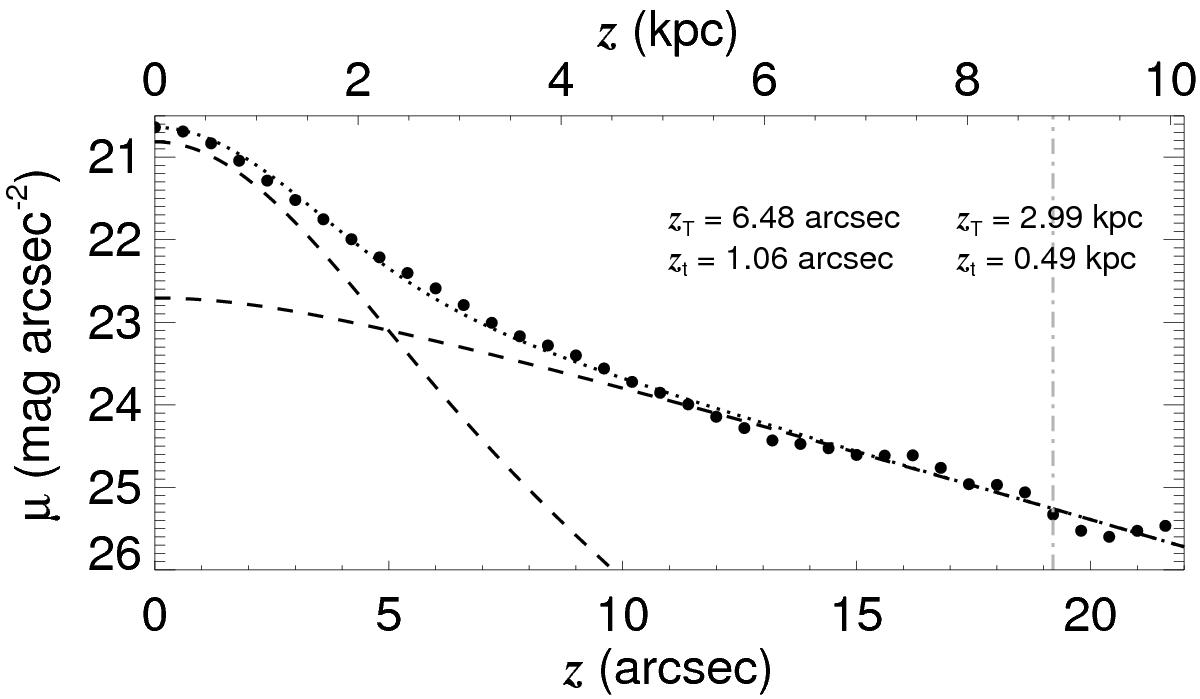
Vertical surface brightness profile at 3.6 μm for regions between 10 and 30″ from the galaxy centre (large dots). The dotted line denotes the fit to the profile and the dashed lines denote the thin and thick disc contributions. zT and zt indicate the thick and thin disc scale heights. The grey dot-dashed line indicates the limit of the height range over which the fit was made.
Current usage metrics show cumulative count of Article Views (full-text article views including HTML views, PDF and ePub downloads, according to the available data) and Abstracts Views on Vision4Press platform.
Data correspond to usage on the plateform after 2015. The current usage metrics is available 48-96 hours after online publication and is updated daily on week days.
Initial download of the metrics may take a while.