Fig. 3
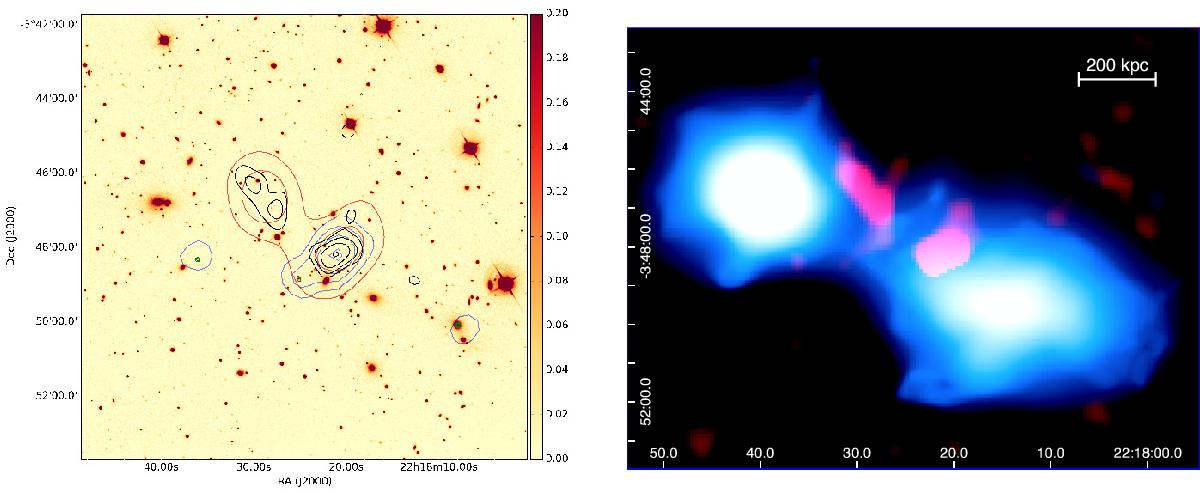
Left: radio emission from VLSSr, TGSS, FIRST, and NVSS in red, black, green, and blue respectively. The contours are at (1,2,4,...) × 4 × σ levels where σ is 90 mJy/beam, 6.0 mJy/beam, 0.24 mJy/beam and 0.6 mJy/beam for the VLSSr, TGSS, FIRST, and NVSS, respectively. The radio emission is overlaid on an SDSS r-band image of the region. Right: wavelet-decomposed 0.5−4.0 keV XMM-Newton image in blue. We show sources with >3σ significance and scales above ~100 kpc. The filamentary structure between two halos is visible in the image. Red shows the 154 MHz radio intensity from the TGSS alternative data release (Intema et al. 2016). Furthermore, there is a structure in the X-ray image at the bridge, which might be the shock-compressed ICM region.
Current usage metrics show cumulative count of Article Views (full-text article views including HTML views, PDF and ePub downloads, according to the available data) and Abstracts Views on Vision4Press platform.
Data correspond to usage on the plateform after 2015. The current usage metrics is available 48-96 hours after online publication and is updated daily on week days.
Initial download of the metrics may take a while.