Fig. 2
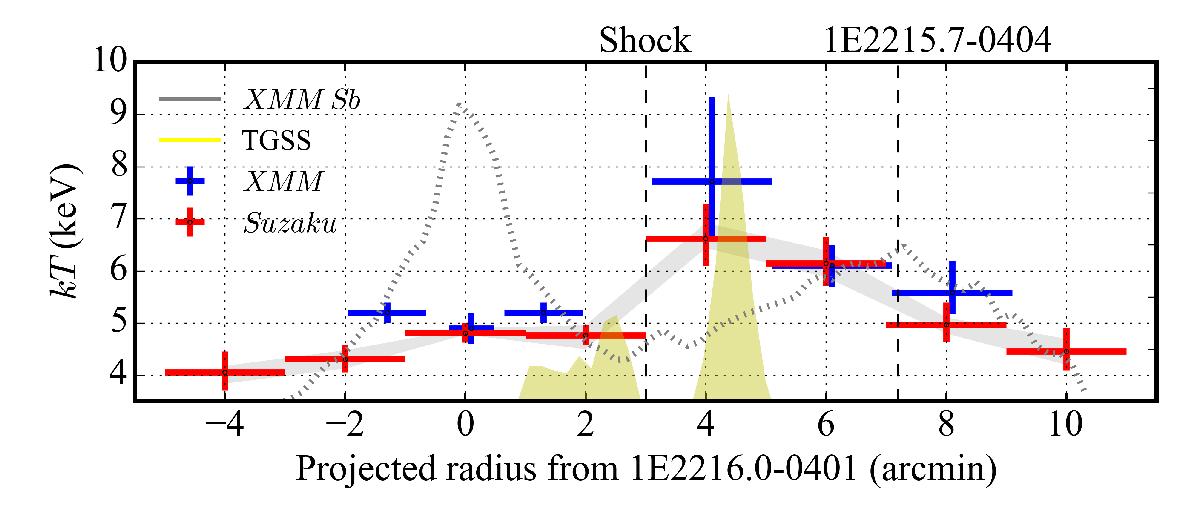
Radial temperature profile of 1E2216.0-0401. Red and blue crosses show Suzaku and XMM-Newton results, respectively. The dashed line indicates the XMM-Newton 0.5−7.0 keV surface brightness profile. The grey range represents the uncertainties of the Suzaku temperature estimation that is due to the combined 3% variation of the NXB level and the 30% fluctuation in the CXB. The yellow region shows GMRT 154 MHz radio emission. The bins of XMM-Newton are slightly offset (0.1′) for clarity.
Current usage metrics show cumulative count of Article Views (full-text article views including HTML views, PDF and ePub downloads, according to the available data) and Abstracts Views on Vision4Press platform.
Data correspond to usage on the plateform after 2015. The current usage metrics is available 48-96 hours after online publication and is updated daily on week days.
Initial download of the metrics may take a while.