Free Access
Fig. 1
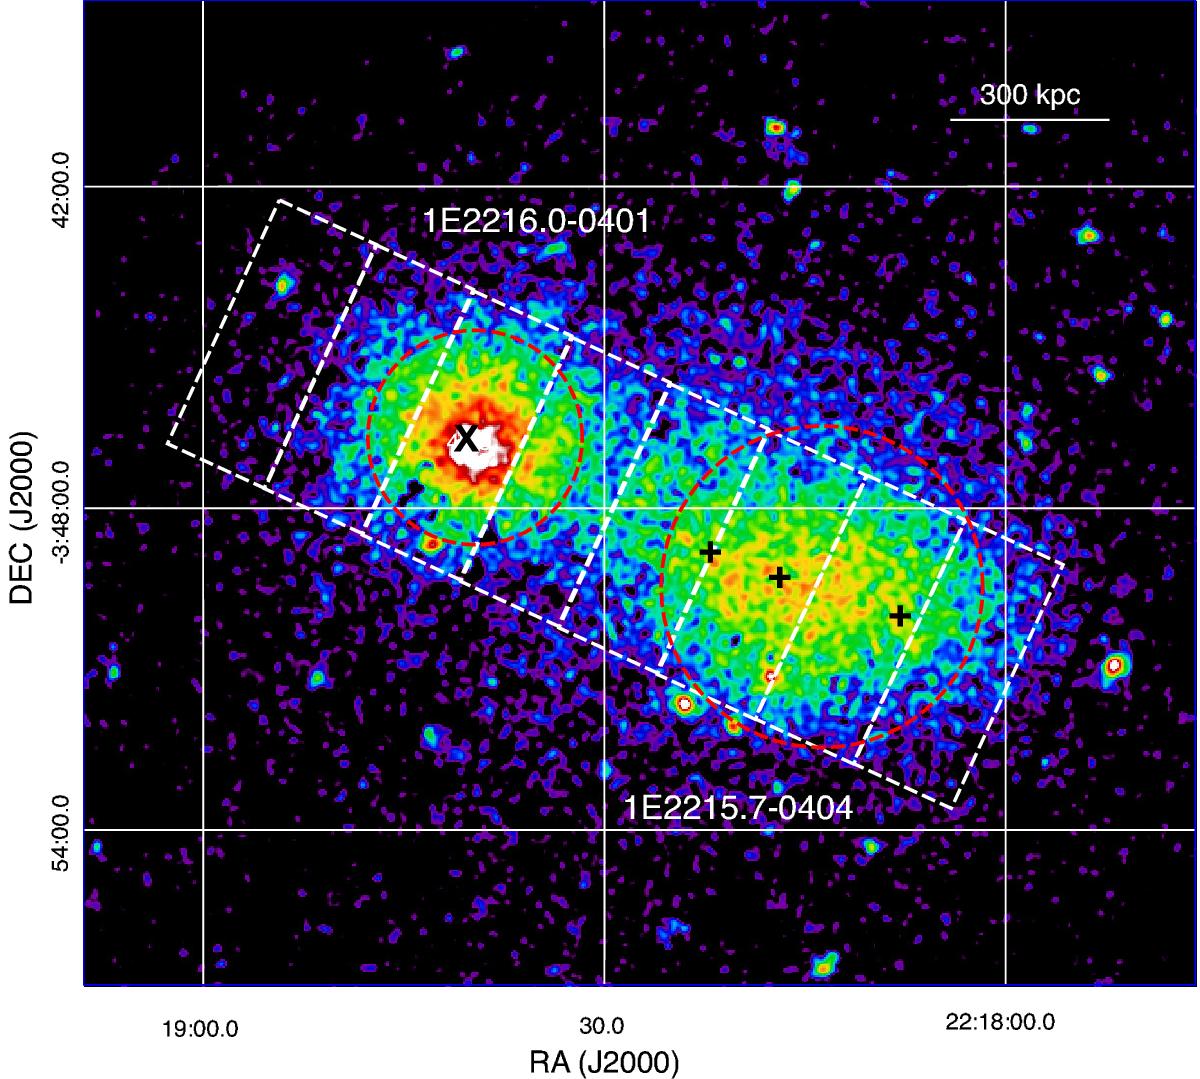
Background-subtracted XMM-Newton image of 1E2216.0-0401 and 1E2215.7-0404 in the 0.8−8.0 keV band. The magenta circles and white boxes (2′ × 5′) show the regions that we discuss in this Letter. The × and + indicate the dominant galaxy(ies) of each cluster.
Current usage metrics show cumulative count of Article Views (full-text article views including HTML views, PDF and ePub downloads, according to the available data) and Abstracts Views on Vision4Press platform.
Data correspond to usage on the plateform after 2015. The current usage metrics is available 48-96 hours after online publication and is updated daily on week days.
Initial download of the metrics may take a while.