Fig. 4
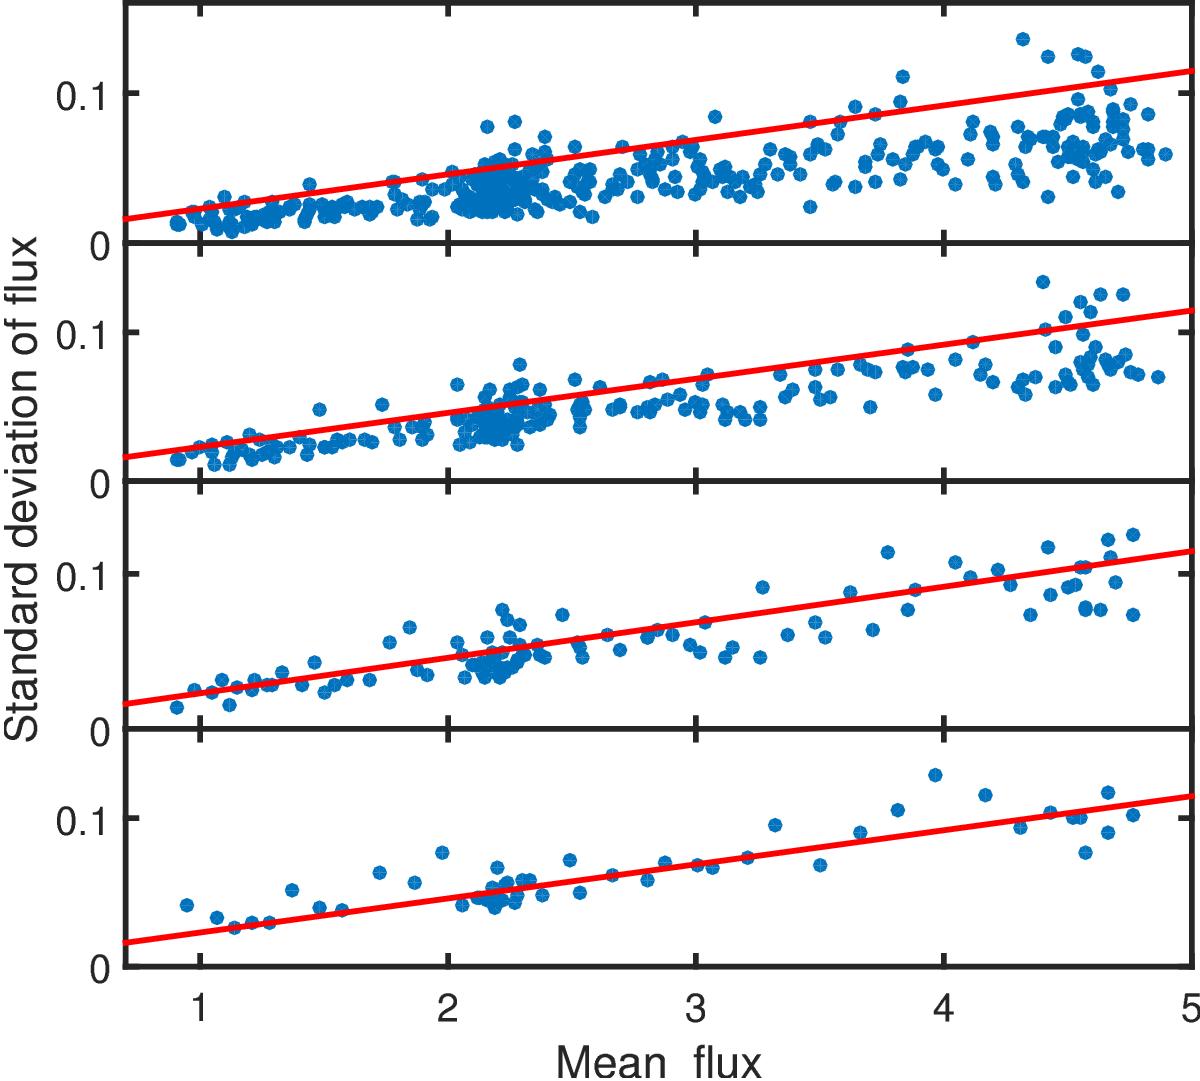
Relation between the MSE and the mean for the light curve in Fig. 3. The simulated data were subdivided into bins, and the means and standard deviations of the values in each bin calculated. Bin widths, from top to bottom, are 25, 50, 100, and 200 points. The straight lines correspond to constant coefficients of variation of 0.023.
Current usage metrics show cumulative count of Article Views (full-text article views including HTML views, PDF and ePub downloads, according to the available data) and Abstracts Views on Vision4Press platform.
Data correspond to usage on the plateform after 2015. The current usage metrics is available 48-96 hours after online publication and is updated daily on week days.
Initial download of the metrics may take a while.