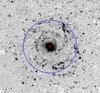
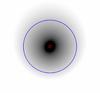
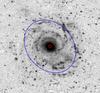
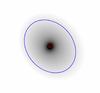
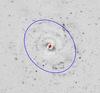
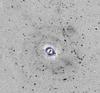
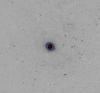
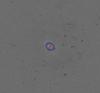
Fig. 3
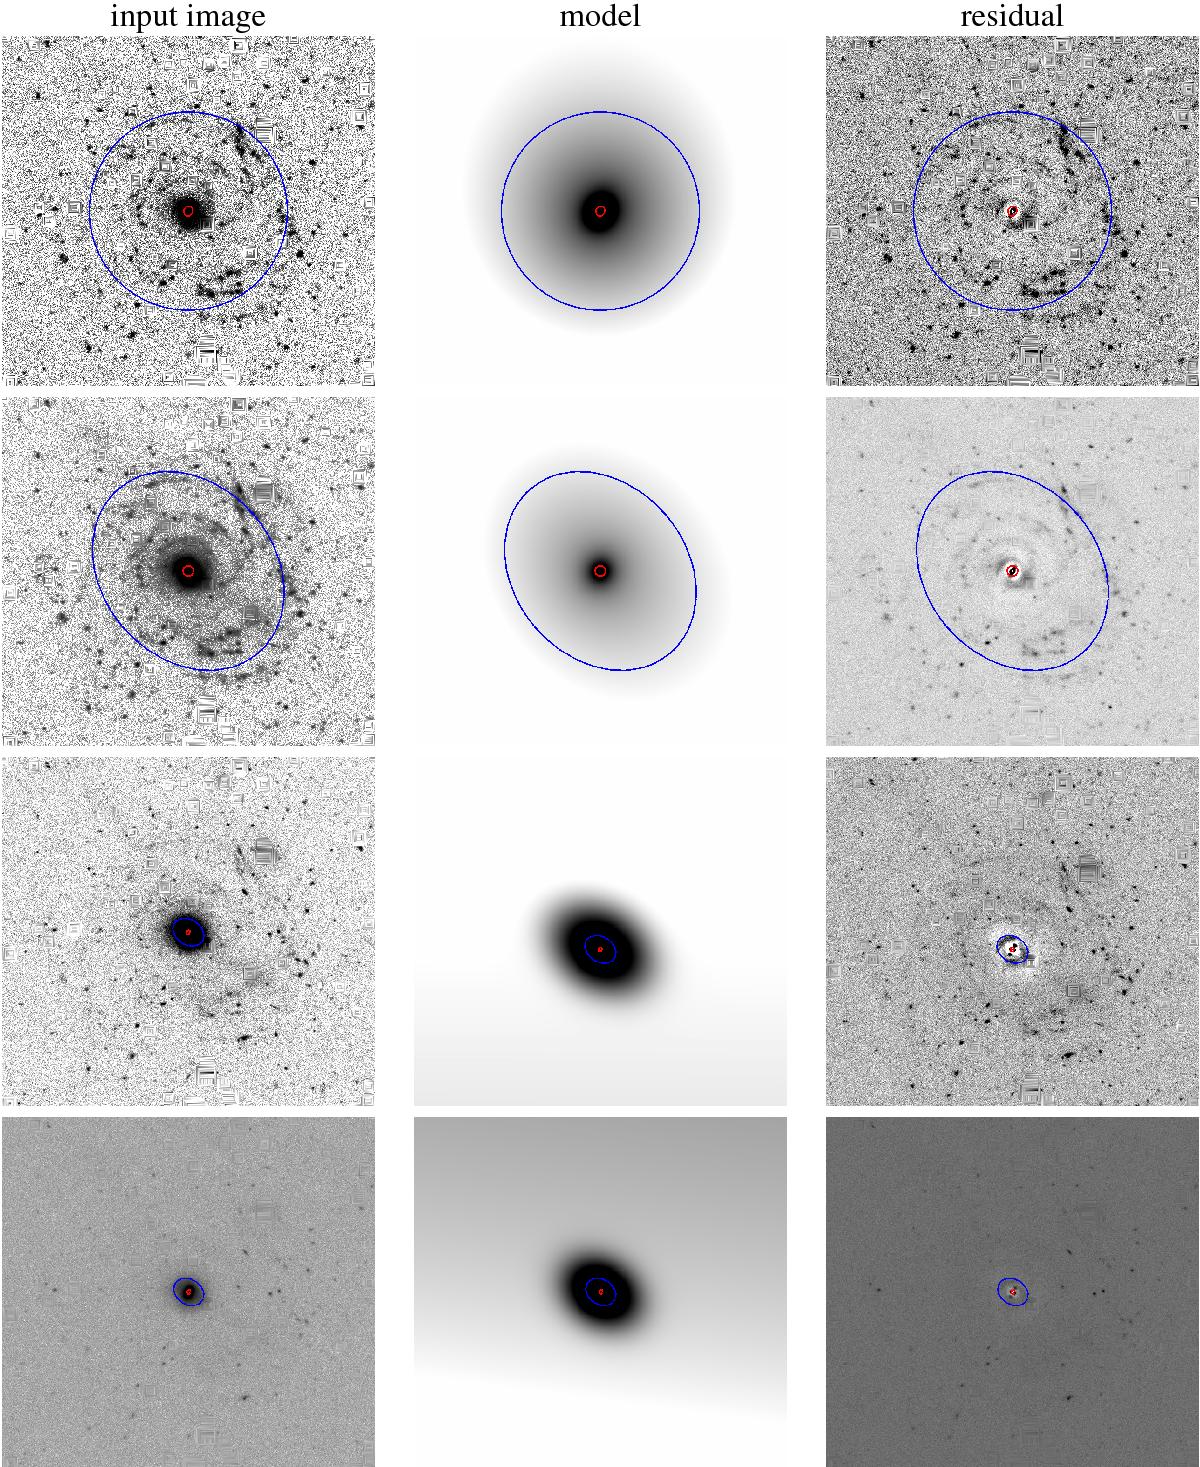
GALFIT results. On the left, we show the input image for GALFIT, in the middle its model, and on the right the residual. In each image, we show 2 ellipses indicating the geometry found by GALFIT in terms of effective radius, PA, axis ratio for the disk (outer blue ellipse) and the sersic component (inner red ellipse). From top to bottom: u, g, i, z.


Current usage metrics show cumulative count of Article Views (full-text article views including HTML views, PDF and ePub downloads, according to the available data) and Abstracts Views on Vision4Press platform.
Data correspond to usage on the plateform after 2015. The current usage metrics is available 48-96 hours after online publication and is updated daily on week days.
Initial download of the metrics may take a while.