Fig. 4
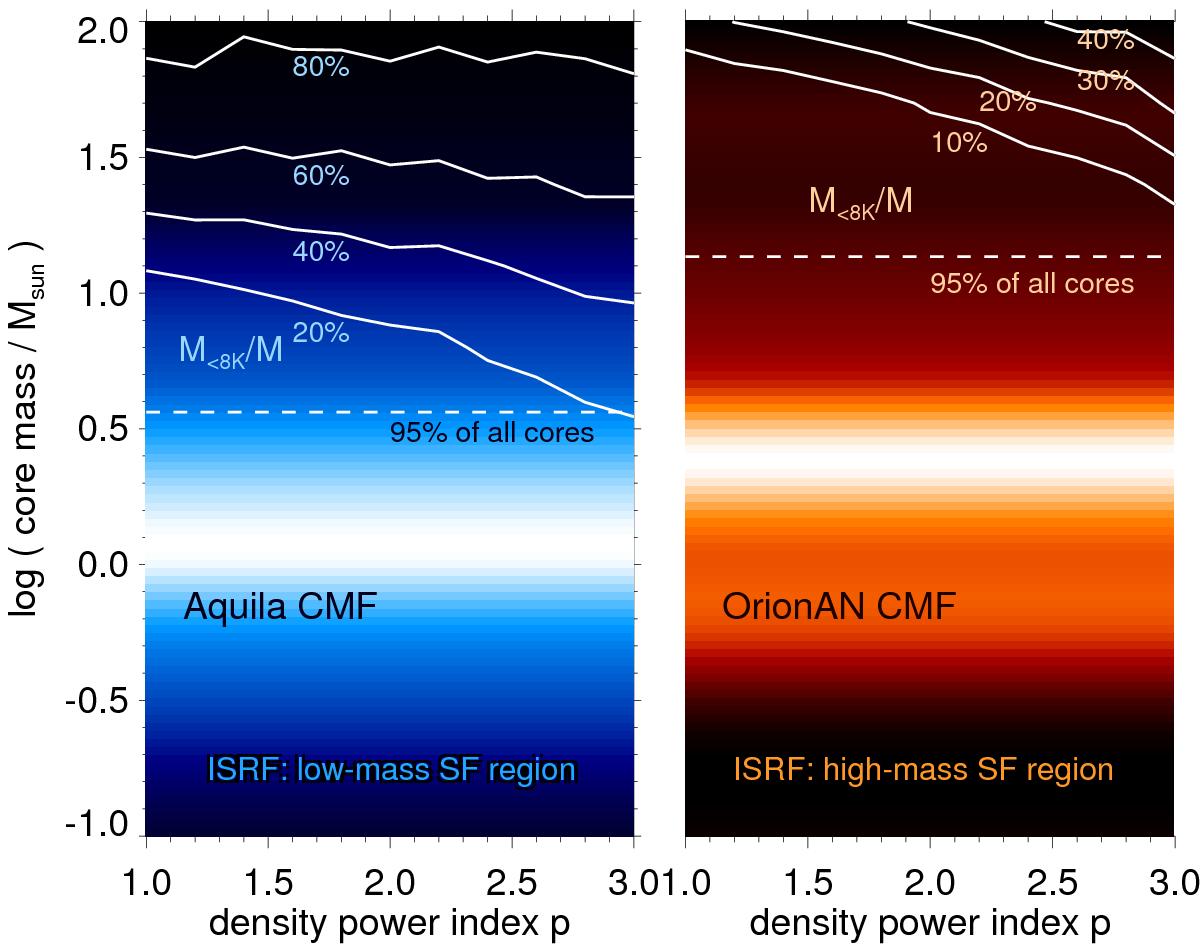
Contours: mass fraction of gas with temperatures <8 K as a function of total core mass, and density power-index p for a low-mass star formation (1-1-1) ISRF (left) and a high-mass star formation (4-4-4) ISRF (right), respectively. Color-coded background: for each p, the core mass functions of Aquila (left) and Orion A North (right) are shown as a function of the core mass. Since the actual p dependence is unknown, we assume that all cores have the same p. The dashed line indicates the mass limit below which 95% of all cores are located.
Current usage metrics show cumulative count of Article Views (full-text article views including HTML views, PDF and ePub downloads, according to the available data) and Abstracts Views on Vision4Press platform.
Data correspond to usage on the plateform after 2015. The current usage metrics is available 48-96 hours after online publication and is updated daily on week days.
Initial download of the metrics may take a while.