Fig. 7
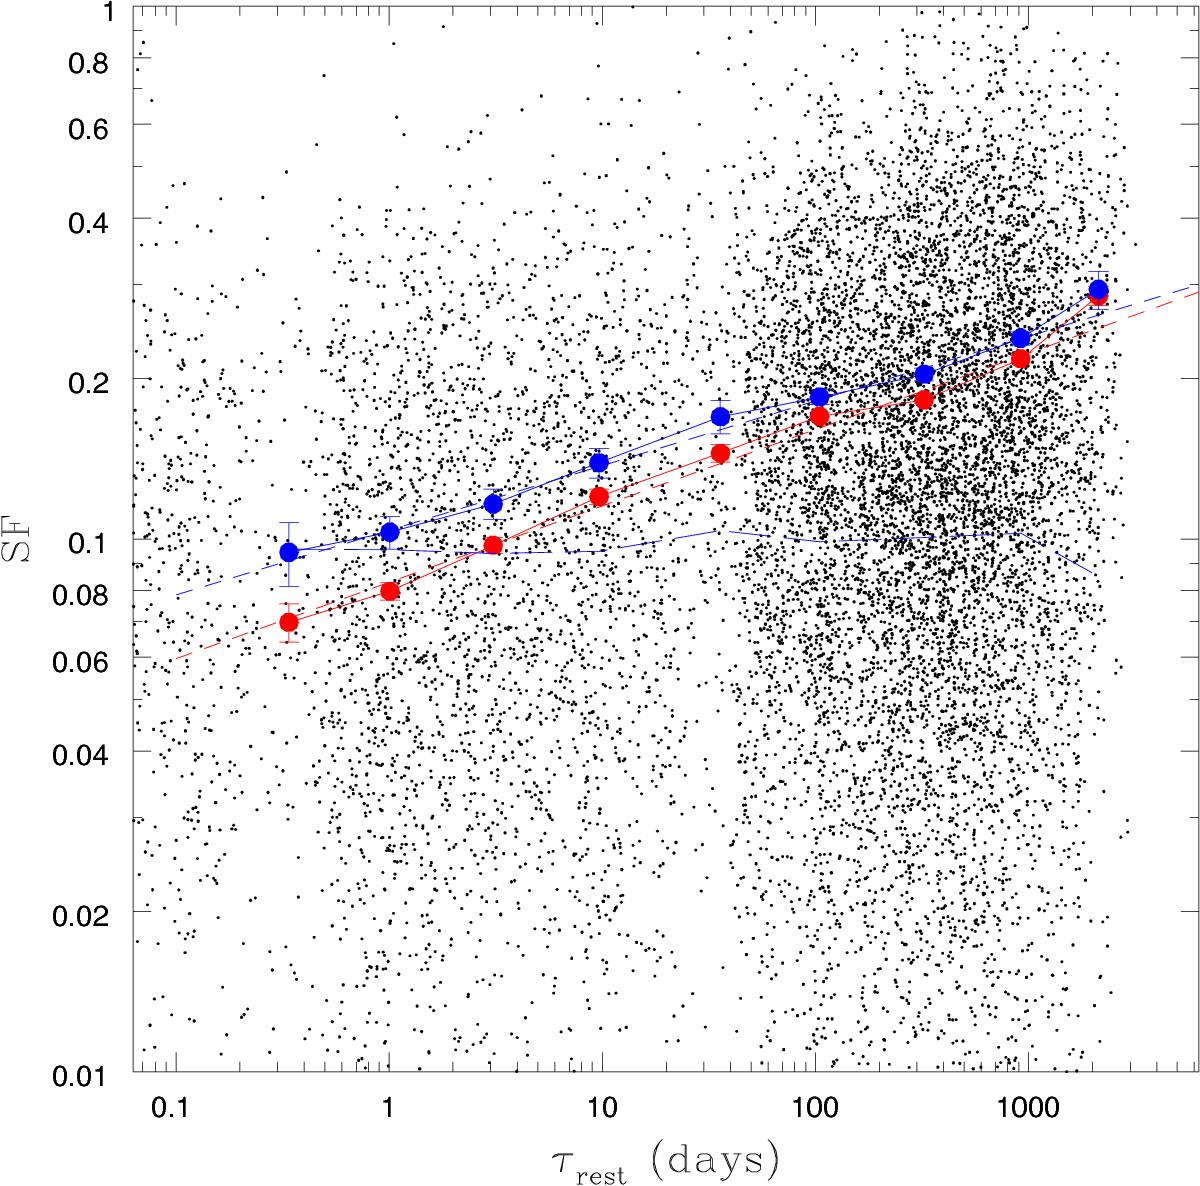
Structure function for the MEXSAS sample. Red points and continuous lines represent the SF computed for the EP9 flux variations, according to Eq. (2); blue points and continuous lines refer to the EP9 band, using Eq. (3). Red and blue short-dashed lines indicate the corresponding least-squares fits. Blue long-dashed line indicates the contribution of the photometric errors (the same for Eqs. (2) and (3)). Black dots represent the variations for the individual pairs of measurements contributing to the SF.
Current usage metrics show cumulative count of Article Views (full-text article views including HTML views, PDF and ePub downloads, according to the available data) and Abstracts Views on Vision4Press platform.
Data correspond to usage on the plateform after 2015. The current usage metrics is available 48-96 hours after online publication and is updated daily on week days.
Initial download of the metrics may take a while.