Fig. 5
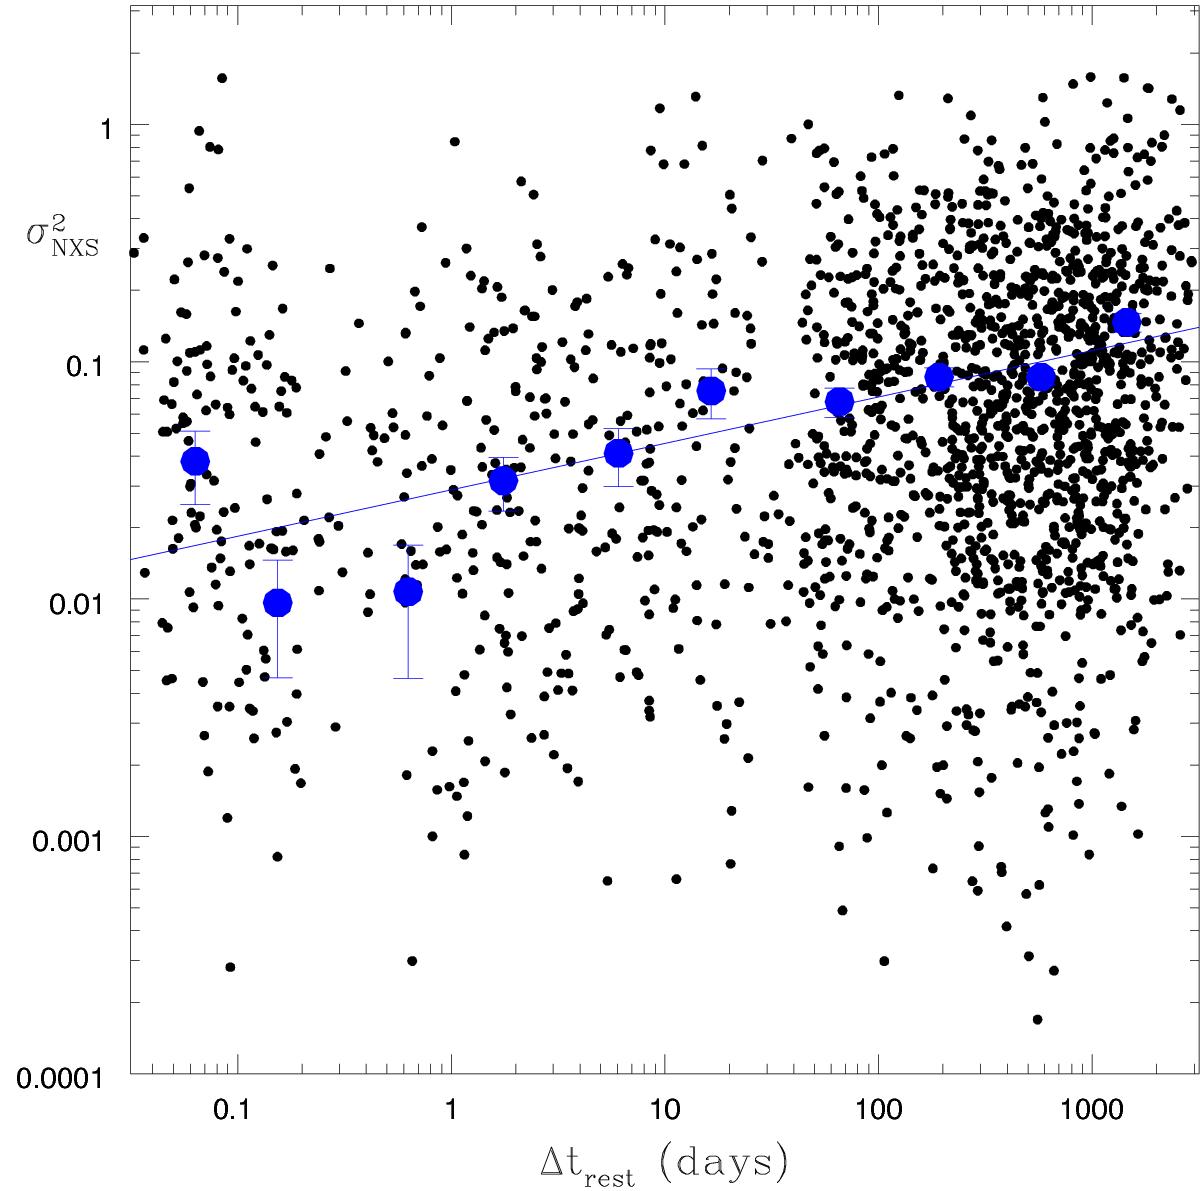
NXS as a function of the light curve duration in the rest frame, Δtrest. Black dots represent individual NXS values. Blue circles are ensemble averages in bins of Δtrest. The solid blue line shows a linear least-squares fit to the logarithms of the binned values with slope a = 0.196 ± 0.040. The Pearson correlation coefficient is r = 0.84, with null probability P( >| r | ) = 0.008.
Current usage metrics show cumulative count of Article Views (full-text article views including HTML views, PDF and ePub downloads, according to the available data) and Abstracts Views on Vision4Press platform.
Data correspond to usage on the plateform after 2015. The current usage metrics is available 48-96 hours after online publication and is updated daily on week days.
Initial download of the metrics may take a while.