Free Access
Fig. 11
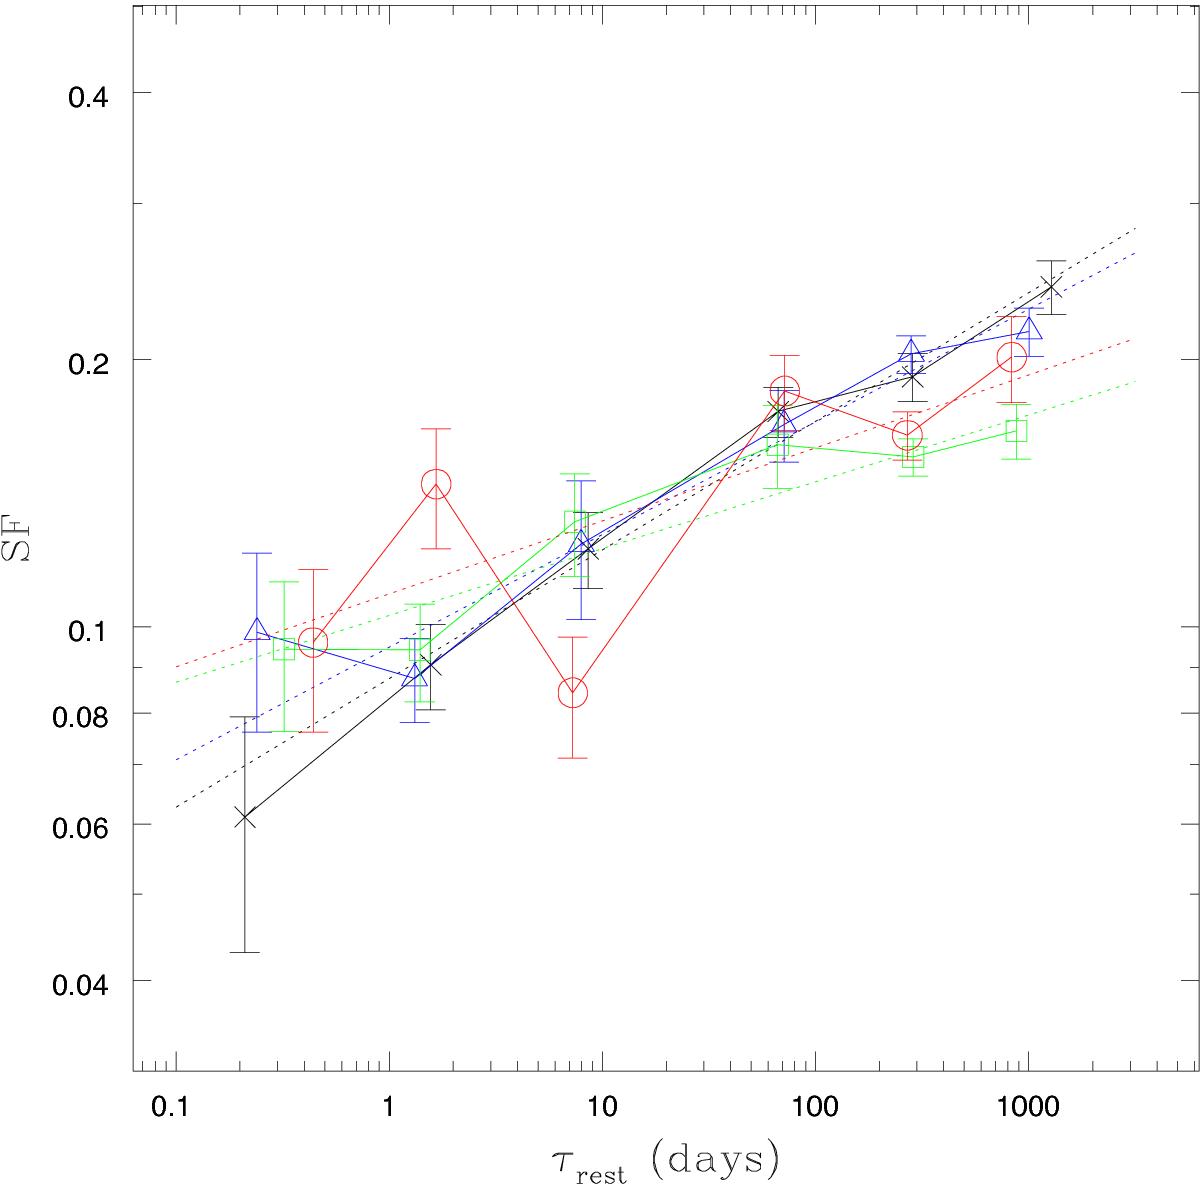
Structure function in bins of redshift. Black lines and crosses represent 0 <z ≤ 1.15; blue lines and triangles indicate 1.15 <z ≤ 1.7; green lines and squares denote 1.7 <z ≤ 2.3; and red lines and circles indicate 2.3 <z ≤ 3.4.
Current usage metrics show cumulative count of Article Views (full-text article views including HTML views, PDF and ePub downloads, according to the available data) and Abstracts Views on Vision4Press platform.
Data correspond to usage on the plateform after 2015. The current usage metrics is available 48-96 hours after online publication and is updated daily on week days.
Initial download of the metrics may take a while.