Fig. 10
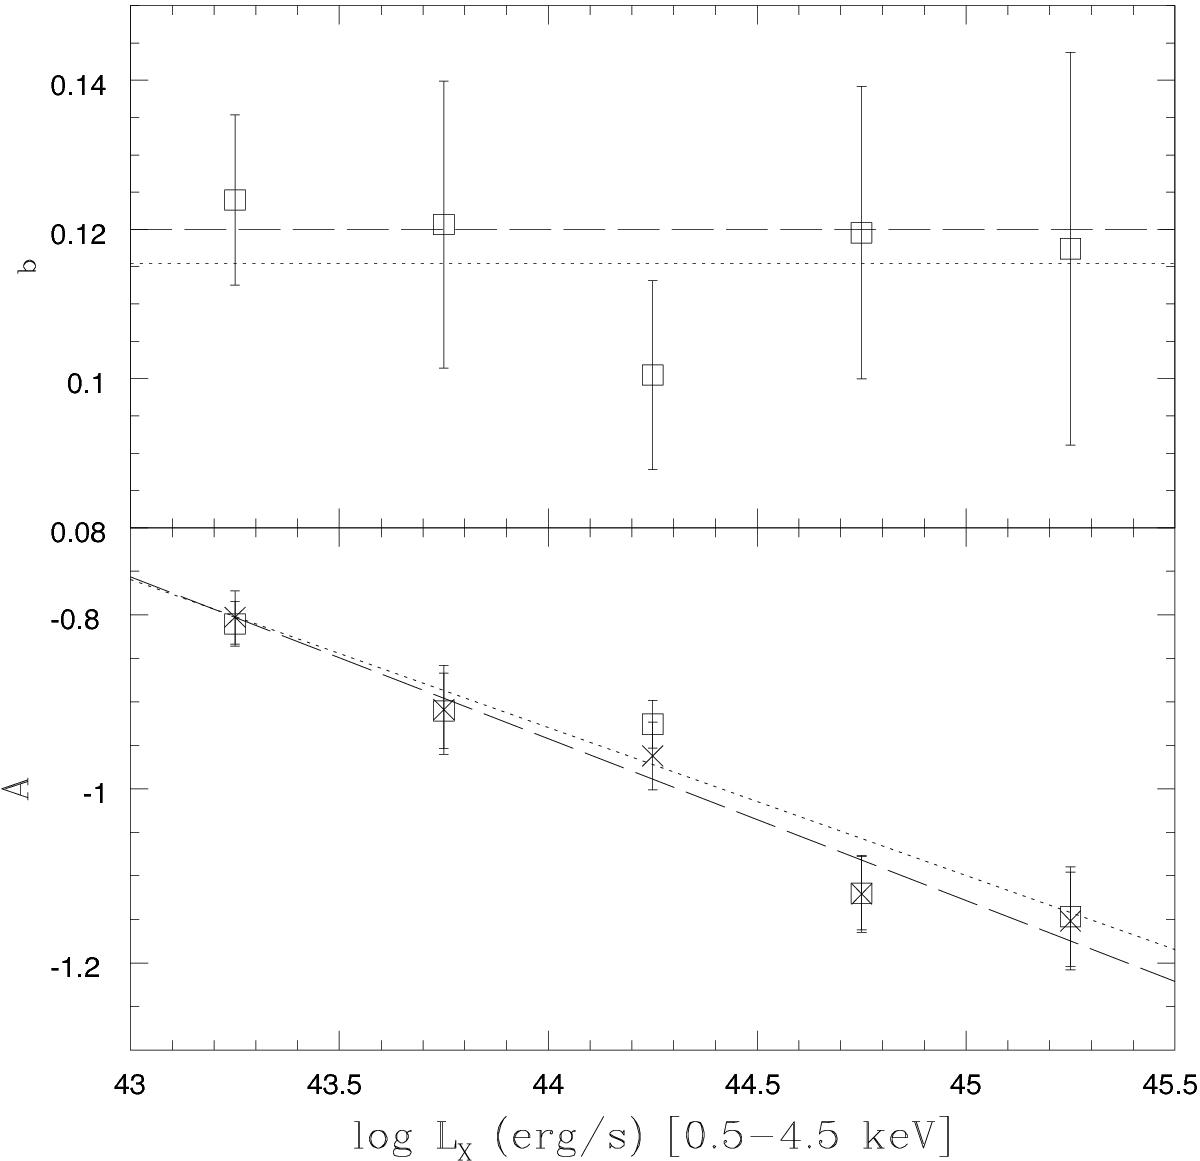
Structure function parameters as functions of the X-ray luminosity. Upper panel: slope b; the dotted line indicates the average ⟨b⟩ = 0.115; the dashed line indicates the fixed value b = 0.12, adopting the same dependence as in the general SF of Fig. 7. Lower panel: the intercept A. The open squares represent the values derived by the SFs of Fig. 9, with free A and b. The crosses are the values derived with fixed b = 0.12. The corresponding fits are shown with dotted lines (free b, A = (6.55 ± 1.42)−(0.17 ± 0.03)log LX) and dashed lines (fixed b, A = (7.24 ± 0.81)−(0.19 ± 0.02)log LX).
Current usage metrics show cumulative count of Article Views (full-text article views including HTML views, PDF and ePub downloads, according to the available data) and Abstracts Views on Vision4Press platform.
Data correspond to usage on the plateform after 2015. The current usage metrics is available 48-96 hours after online publication and is updated daily on week days.
Initial download of the metrics may take a while.