Fig. 6
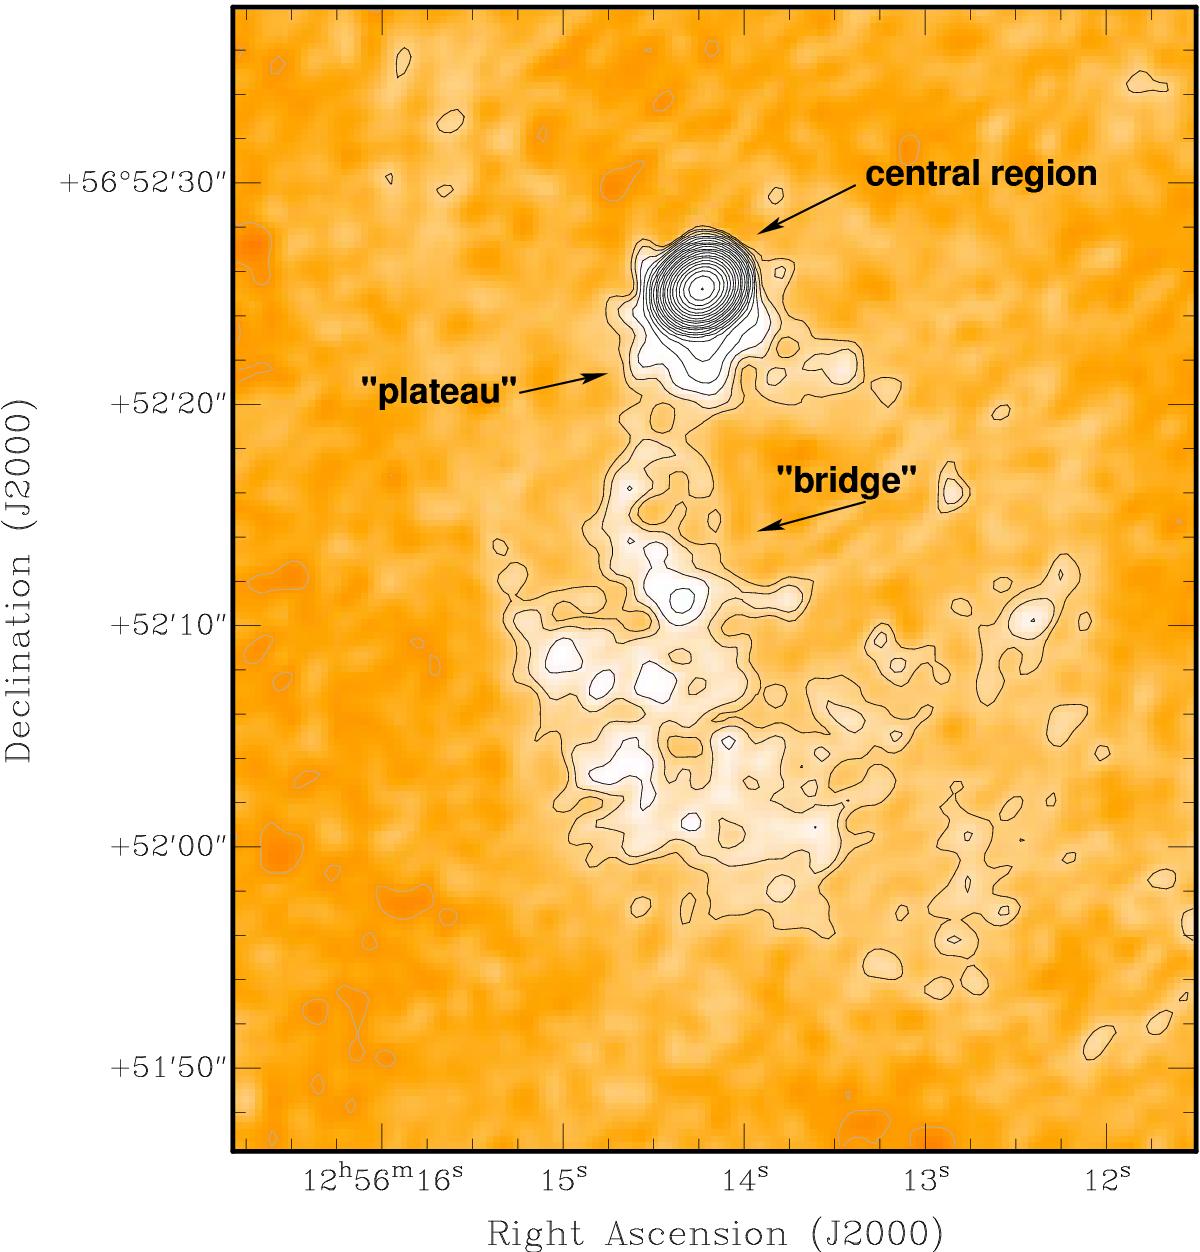
Radio continuum image obtained from the VLA data using robust 0.5 weighting (1′′ = 0.867 kpc). The different components (bright core, plateau, bridge structure in the southern lobe) are clearly visible (see text for details). The contour levels range from −0.07, 0.07 mJy beam-1 to 250 mJy beam-1 with increasing factors of 1.5.
Current usage metrics show cumulative count of Article Views (full-text article views including HTML views, PDF and ePub downloads, according to the available data) and Abstracts Views on Vision4Press platform.
Data correspond to usage on the plateform after 2015. The current usage metrics is available 48-96 hours after online publication and is updated daily on week days.
Initial download of the metrics may take a while.