Fig. 5
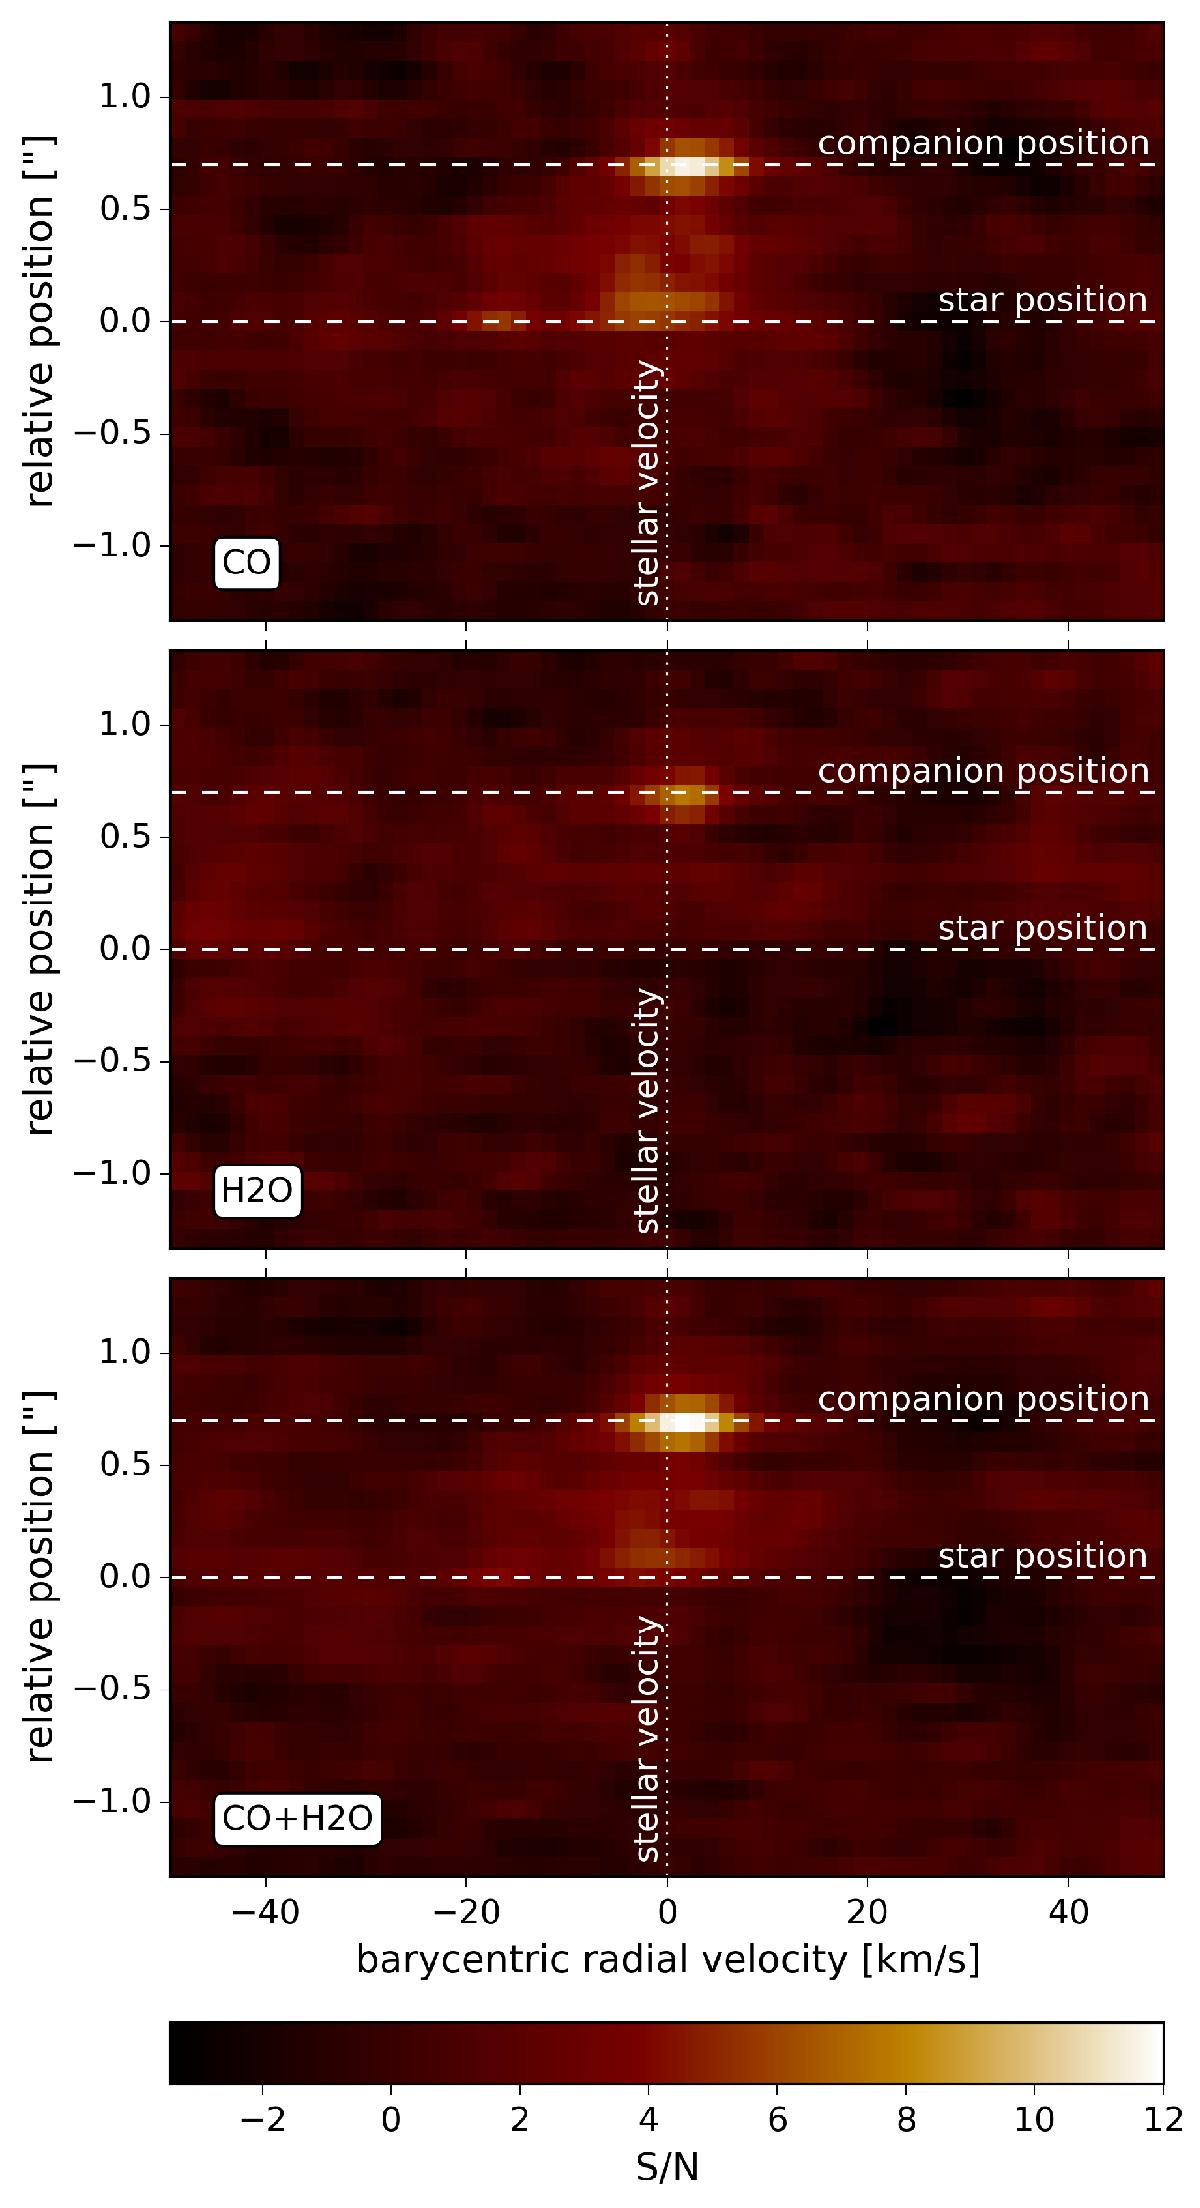
Strength of the cross-correlation as function of slit position and radial velocity for the three best-fit models (see Fig. 3). We detect both CO and H2O using single-trace gas models with a S/N of 11.6 for CO and 7.7 for H2O, and the signal from the double-trace gas model is marginally stronger with a S/N of 12.3. These cross-correlation arrays are the averages from the two central CRIRES detectors.
Current usage metrics show cumulative count of Article Views (full-text article views including HTML views, PDF and ePub downloads, according to the available data) and Abstracts Views on Vision4Press platform.
Data correspond to usage on the plateform after 2015. The current usage metrics is available 48-96 hours after online publication and is updated daily on week days.
Initial download of the metrics may take a while.