Fig. 2
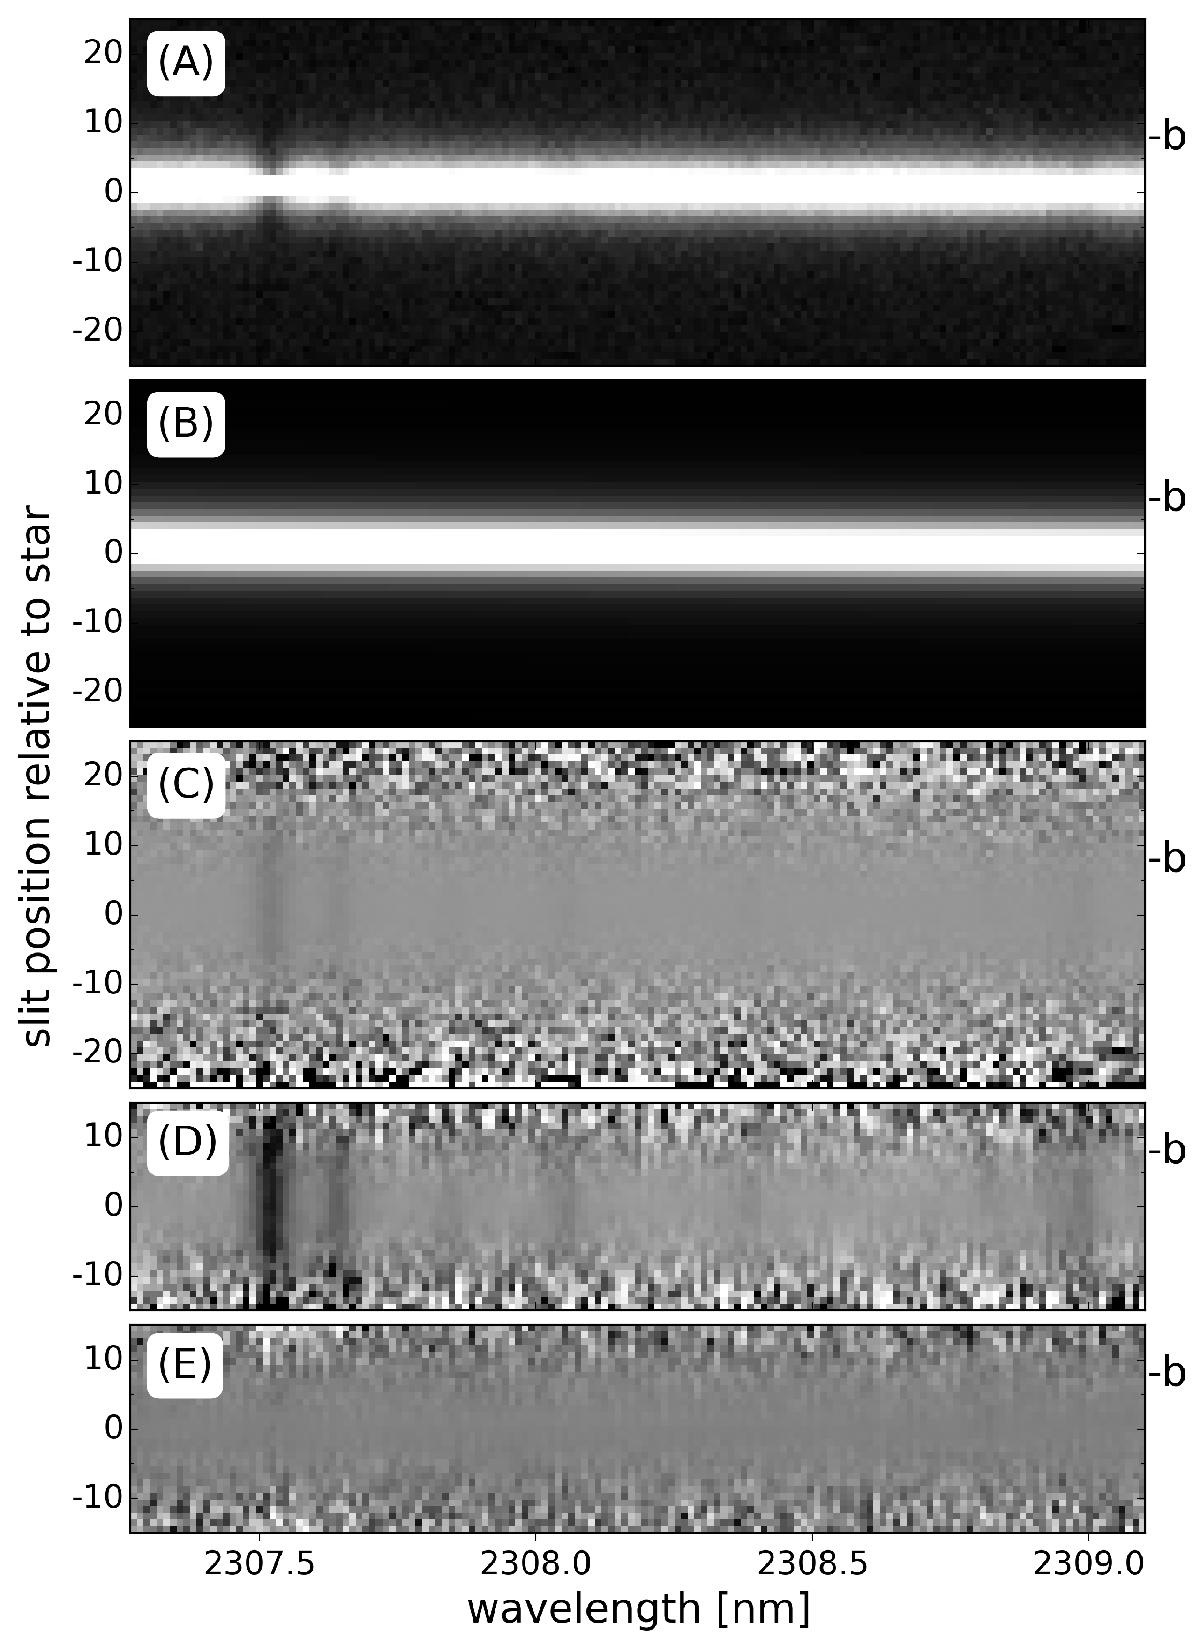
Illustration of the data analysis steps from a short wavelength range from detector 2. The y-axis depicts the slit position relative to the star, with the slit position of the companion indicated by a “b” on the right-hand axes. The greyscales were adjusted individually for each array with an IRAF-like z-scale algorithm. Top to bottom: A) the AB-combined image corrected for bad pixels; B) the spatial profiles of the star; C) the image after each row has been normalised with the rows of the spatial profile array; D) the spatial spectra (i.e. rectified for the trace); and E) the residual spatial spectra after removing stellar and telluric lines.
Current usage metrics show cumulative count of Article Views (full-text article views including HTML views, PDF and ePub downloads, according to the available data) and Abstracts Views on Vision4Press platform.
Data correspond to usage on the plateform after 2015. The current usage metrics is available 48-96 hours after online publication and is updated daily on week days.
Initial download of the metrics may take a while.