Fig. 1
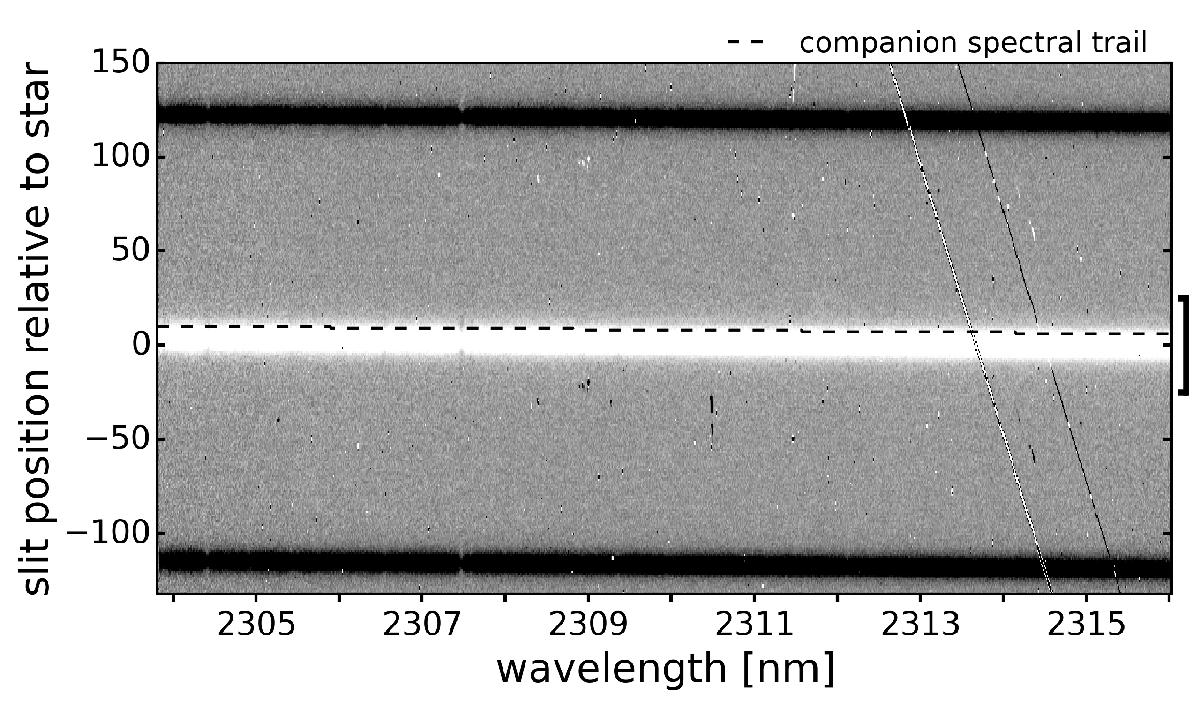
One of the combined image frames from detector 2. This is an intermediate data product from the CRIRES pipeline, and it is the combination of an AB nodding pair of exposures. The central rows that are used in the further data analysis are indicated on the right axis. The stellar spectral trail is clearly visible as the central white band, and the location of the hidden spectral trail from GQ Lupi b is indicated with a dashed line. The two diagonal stripes towards the right end are detector defects.
Current usage metrics show cumulative count of Article Views (full-text article views including HTML views, PDF and ePub downloads, according to the available data) and Abstracts Views on Vision4Press platform.
Data correspond to usage on the plateform after 2015. The current usage metrics is available 48-96 hours after online publication and is updated daily on week days.
Initial download of the metrics may take a while.