Fig. 8
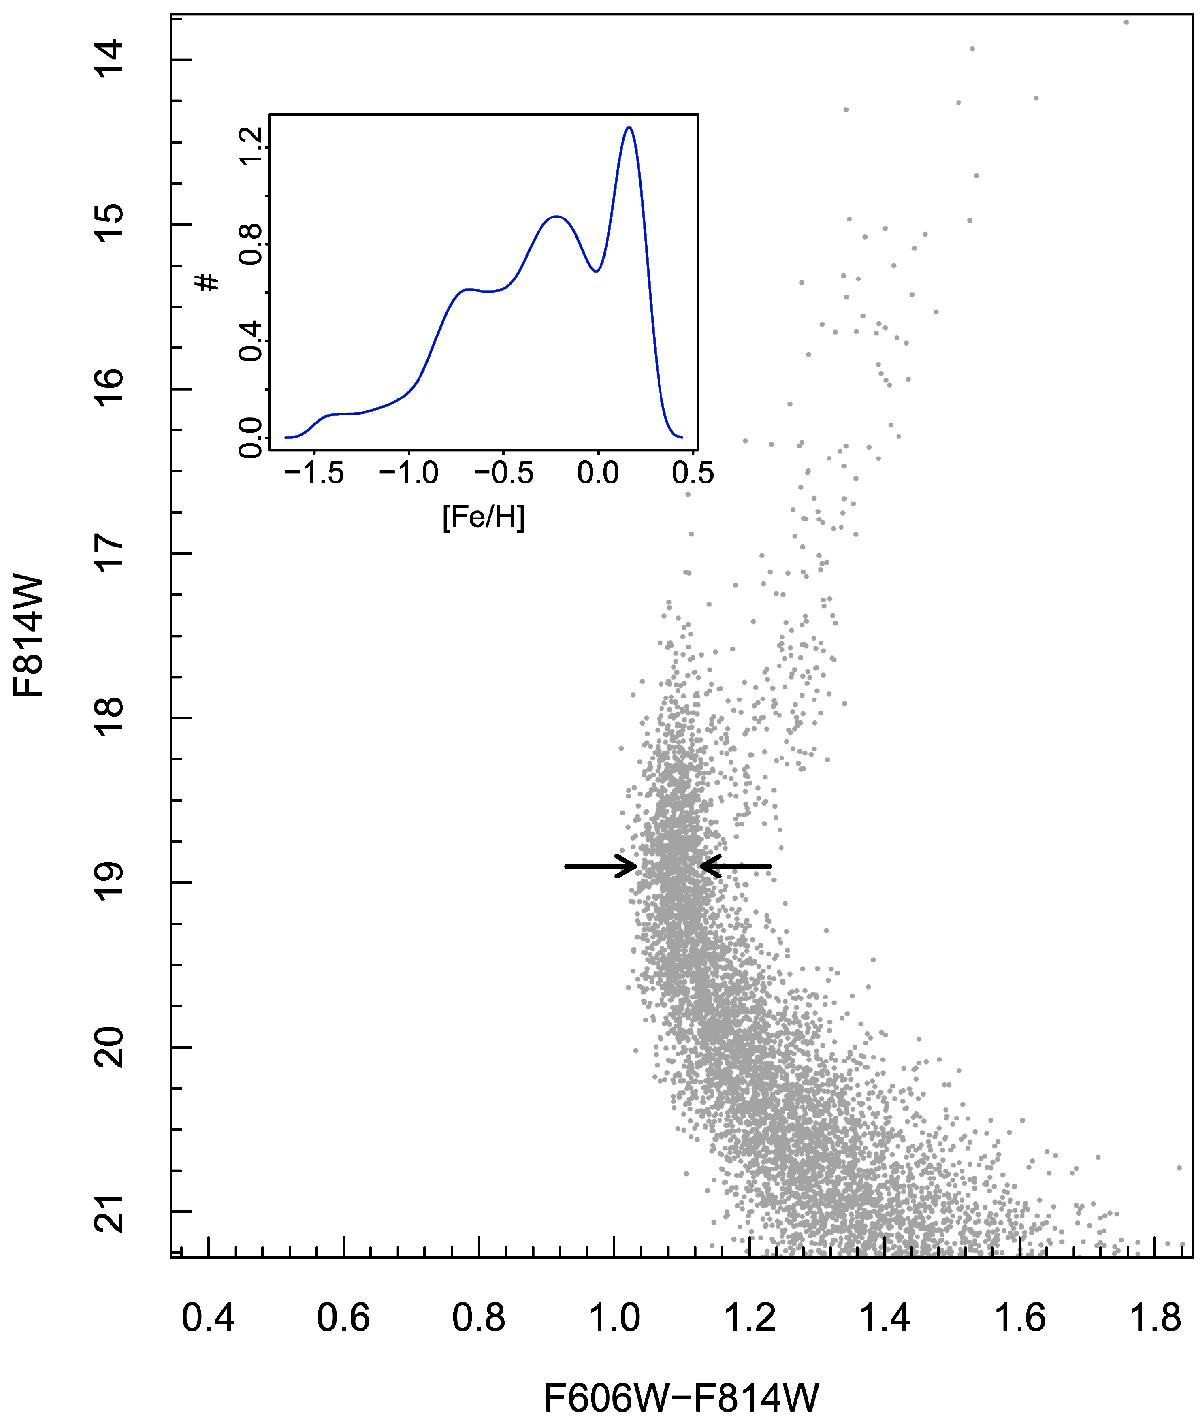
Monte Carlo simulations of the CMD of Fig. 3 in the F814W/F606W−F814W bands, as described in the text. A dispersion of 0.26 mag has been applied on the magnitudes to take the spread in distance into account, 0.016 mag on colors to take the differential extinction into account, and 30% binaries. The two arrows in each plot correspond to a separation of 0.10 mag. The inset frame shows the corresponding metallicity distribution of the simulation. The percentage of objects younger than 9 Gyr in this plot is 34%.
Current usage metrics show cumulative count of Article Views (full-text article views including HTML views, PDF and ePub downloads, according to the available data) and Abstracts Views on Vision4Press platform.
Data correspond to usage on the plateform after 2015. The current usage metrics is available 48-96 hours after online publication and is updated daily on week days.
Initial download of the metrics may take a while.