Fig. 11
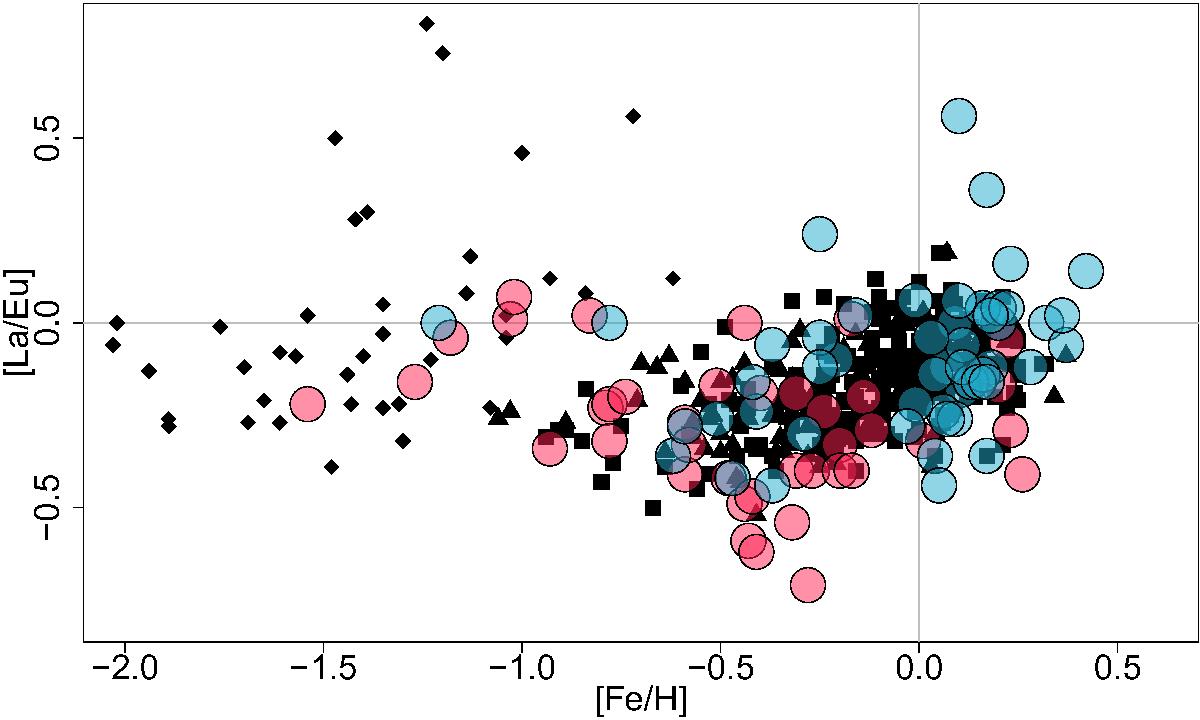
[La/Eu] from Johnson et al. (2012) and Van der Swaelmen et al. (2016; pink and blue larger symbols, respectively) of bulge stars compared to data from Battistini & Bensby (2016; triangles), Mishenina et al. (2013; squares), and Ishigaki et al. (2013; diamonds) for solar vicinity stars. There is no evidence from this data that the bulge and the solar vicinity distributions are different.
Current usage metrics show cumulative count of Article Views (full-text article views including HTML views, PDF and ePub downloads, according to the available data) and Abstracts Views on Vision4Press platform.
Data correspond to usage on the plateform after 2015. The current usage metrics is available 48-96 hours after online publication and is updated daily on week days.
Initial download of the metrics may take a while.