Fig. 9
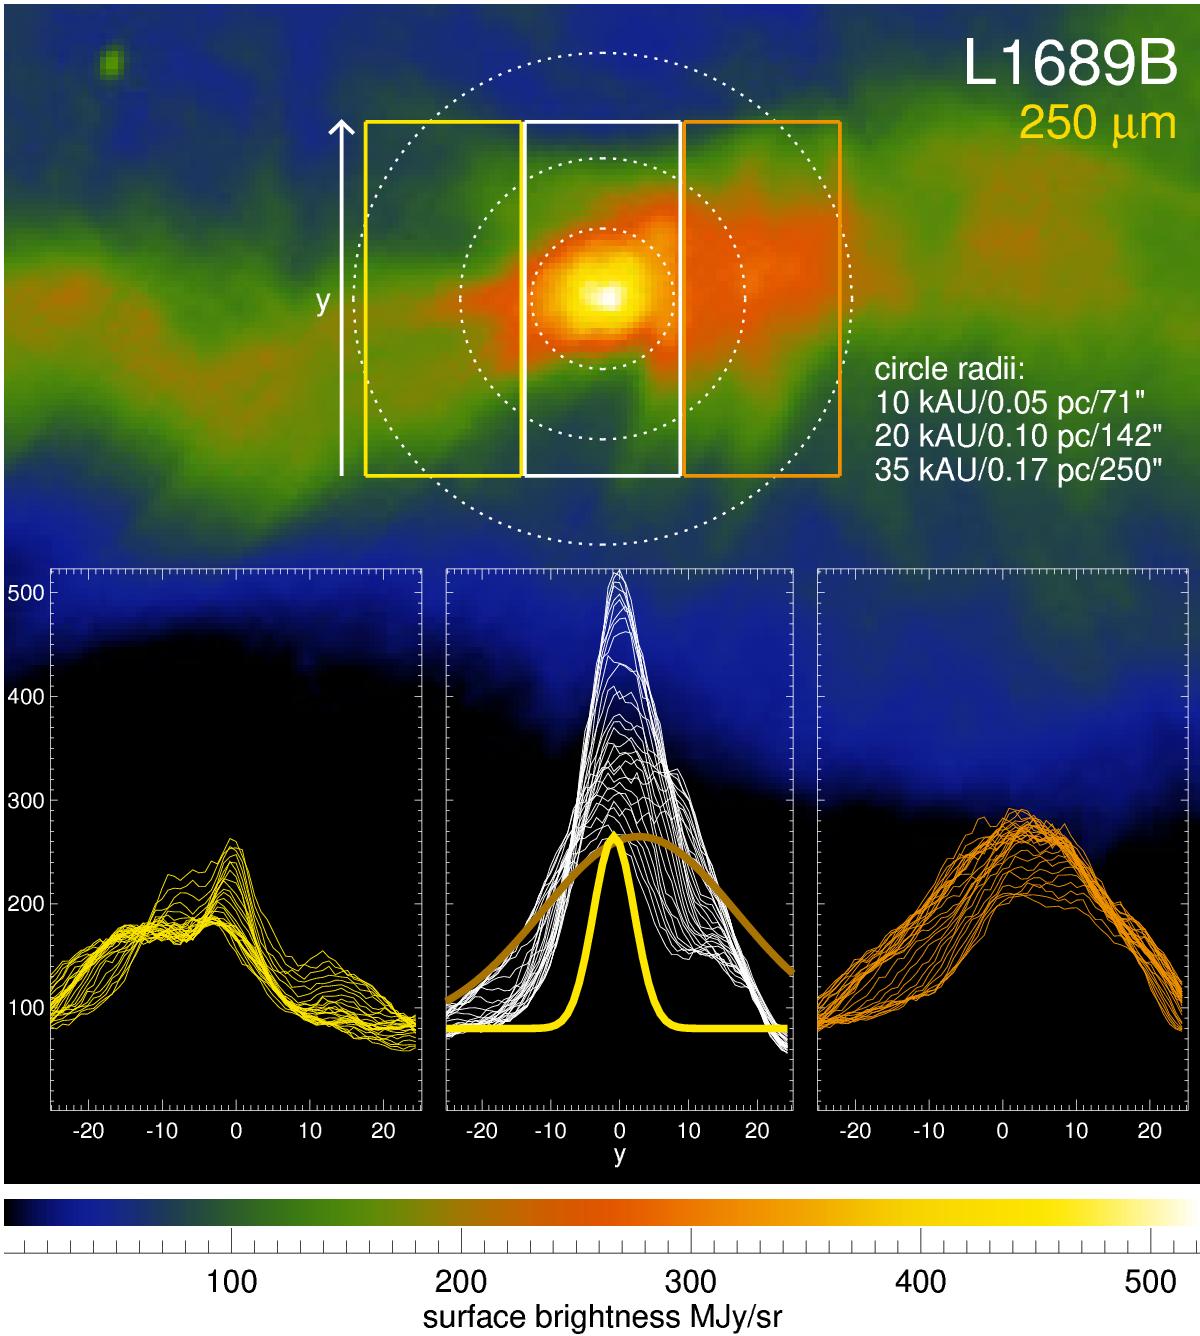
Vertical surface brightness profiles (y direction) in the 250 μm map in three boxes left, central, and right around the core. The left box shows the narrow filament maximum (indicated again in the middle box as yellow line). The right box shows a broader maximum (at about the same level, see brown line in the middle box). The central cuts are shown as white lines in the middle box. Dotted circles indicate the distance from the center.
Current usage metrics show cumulative count of Article Views (full-text article views including HTML views, PDF and ePub downloads, according to the available data) and Abstracts Views on Vision4Press platform.
Data correspond to usage on the plateform after 2015. The current usage metrics is available 48-96 hours after online publication and is updated daily on week days.
Initial download of the metrics may take a while.