Fig. 6
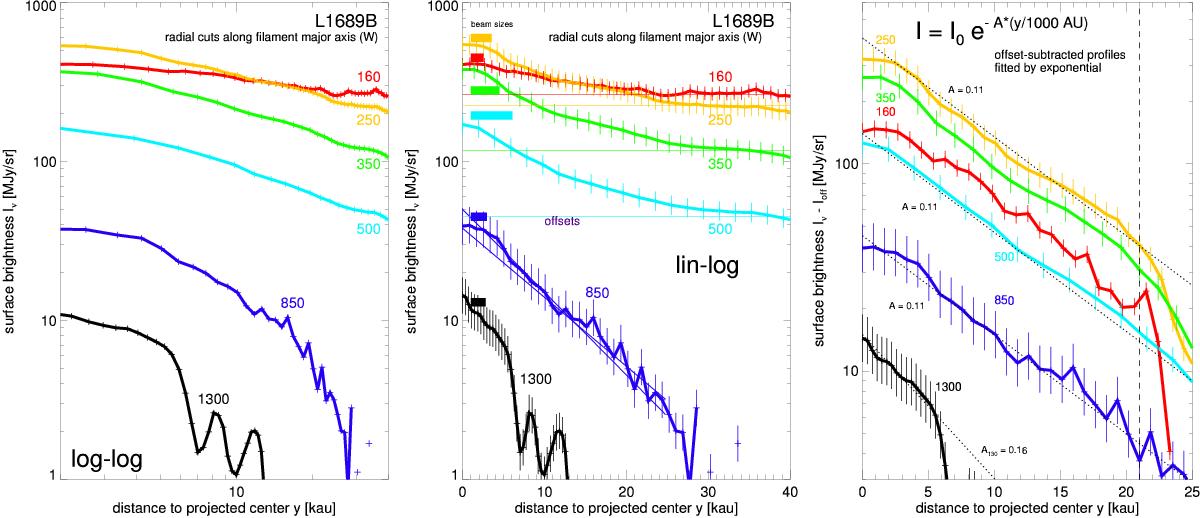
Left and middle: radial cuts of the Herschel maps of L1689B in western direction from the core center. The numbers indicate the wavelength. Calibration error bars are added for the middle panel. The exponential shape of the 850 μm profile is better visible in the lin-log representation. The horizontal thin lines indicates the offset surface brightness from the filament. The two thin blue lines estimate the slope variation in the 800 μm-profile. Right: after subtracting the offsets, all profiles are close to an exponential function with approximately the same exponent A. The dotted lines show the exponential function with A = 0.11. The dashed vertical lines give the distance where deviations from the exponential occur.
Current usage metrics show cumulative count of Article Views (full-text article views including HTML views, PDF and ePub downloads, according to the available data) and Abstracts Views on Vision4Press platform.
Data correspond to usage on the plateform after 2015. The current usage metrics is available 48-96 hours after online publication and is updated daily on week days.
Initial download of the metrics may take a while.