Fig. 19
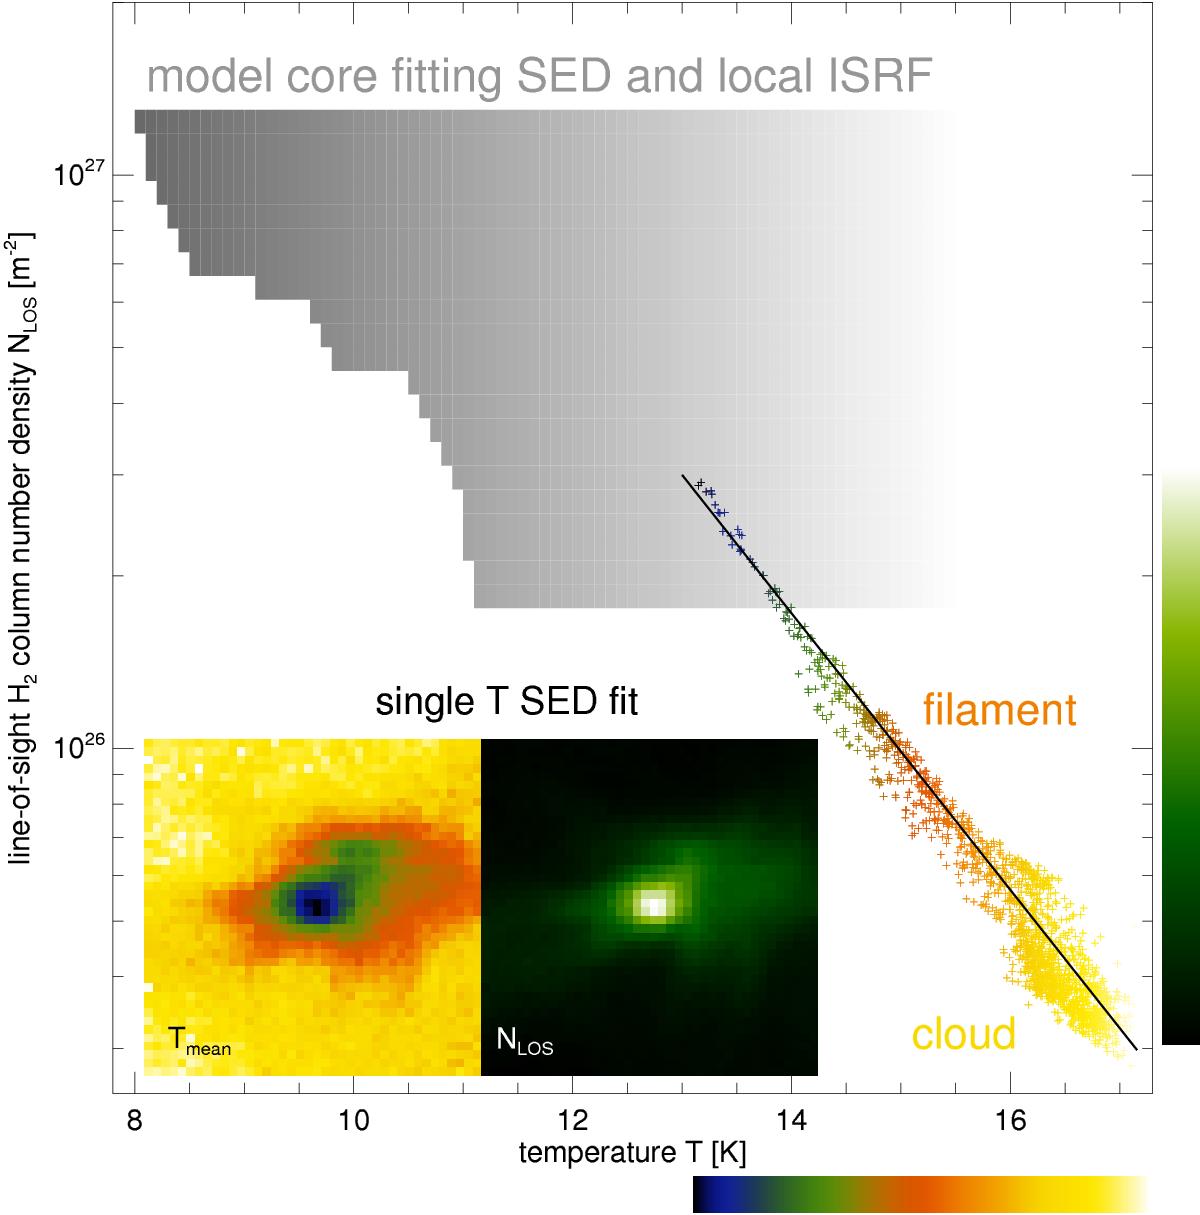
Line-of-sight H2 column number density and temperature for the pixel-by-pixel single temperature SED fit (points along the line, temperature and column density map shown as inlet). The grey-scaled region shows the area where all model column densities and temperature solutions are located (the color-coding is based on the logarithmic density at the various temperatures entering the column density).
Current usage metrics show cumulative count of Article Views (full-text article views including HTML views, PDF and ePub downloads, according to the available data) and Abstracts Views on Vision4Press platform.
Data correspond to usage on the plateform after 2015. The current usage metrics is available 48-96 hours after online publication and is updated daily on week days.
Initial download of the metrics may take a while.