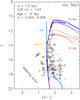
Fig. 5
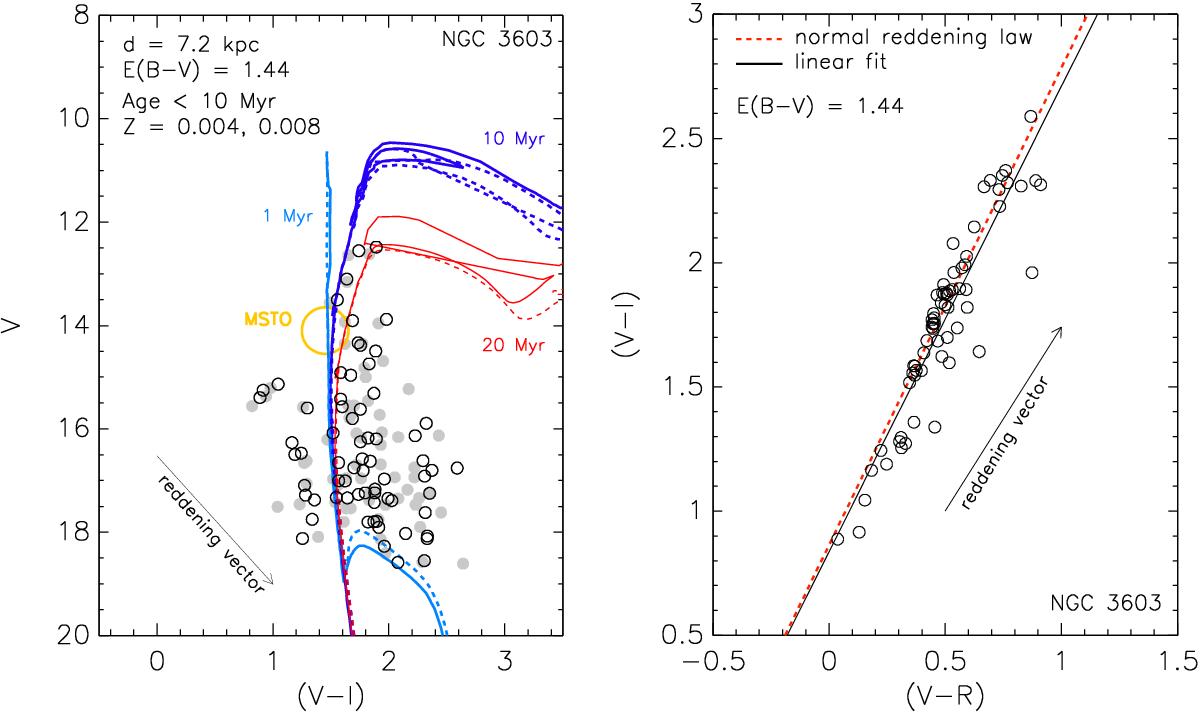
Left: Colour–magnitude diagram of NGC 3603, constructed using synthetic photometry (open black circles). Filled grey circles represent the WEBDA catalogue magnitudes (Sagar et al. 2001), shown for comparison. Isochrones of Z = 0.004, log t = 6.0 (1 Myr, cyan) and 7.0 (10 Myr, blue) are plotted with solid lines, those of the same ages at Z = 0.008 with dashed lines. Non-fitting isochrones of 20 Myr are also plotted (red). The position of the main-sequence turn-off point (MSTO) is indicated with a yellow circle. Right: two-colour diagram of NGC 3603, also constructed using synthetic photometry (open black circles). The solid black line indicates a linear regression, the dashed red line the normal interstellar extinction law. Following Sagar et al. (2001), colour excess ratios of E(V−R) /E(B−V) = 0.65 (Alcalá & Arellano Ferro 1988) and E(V−I) /E(B−V) = 1.25 (Dean et al. 1978) are used for the normal extinction law. The directions of the normal reddening vectors are shown with arrows in both diagrams.
Current usage metrics show cumulative count of Article Views (full-text article views including HTML views, PDF and ePub downloads, according to the available data) and Abstracts Views on Vision4Press platform.
Data correspond to usage on the plateform after 2015. The current usage metrics is available 48-96 hours after online publication and is updated daily on week days.
Initial download of the metrics may take a while.