Fig. 4
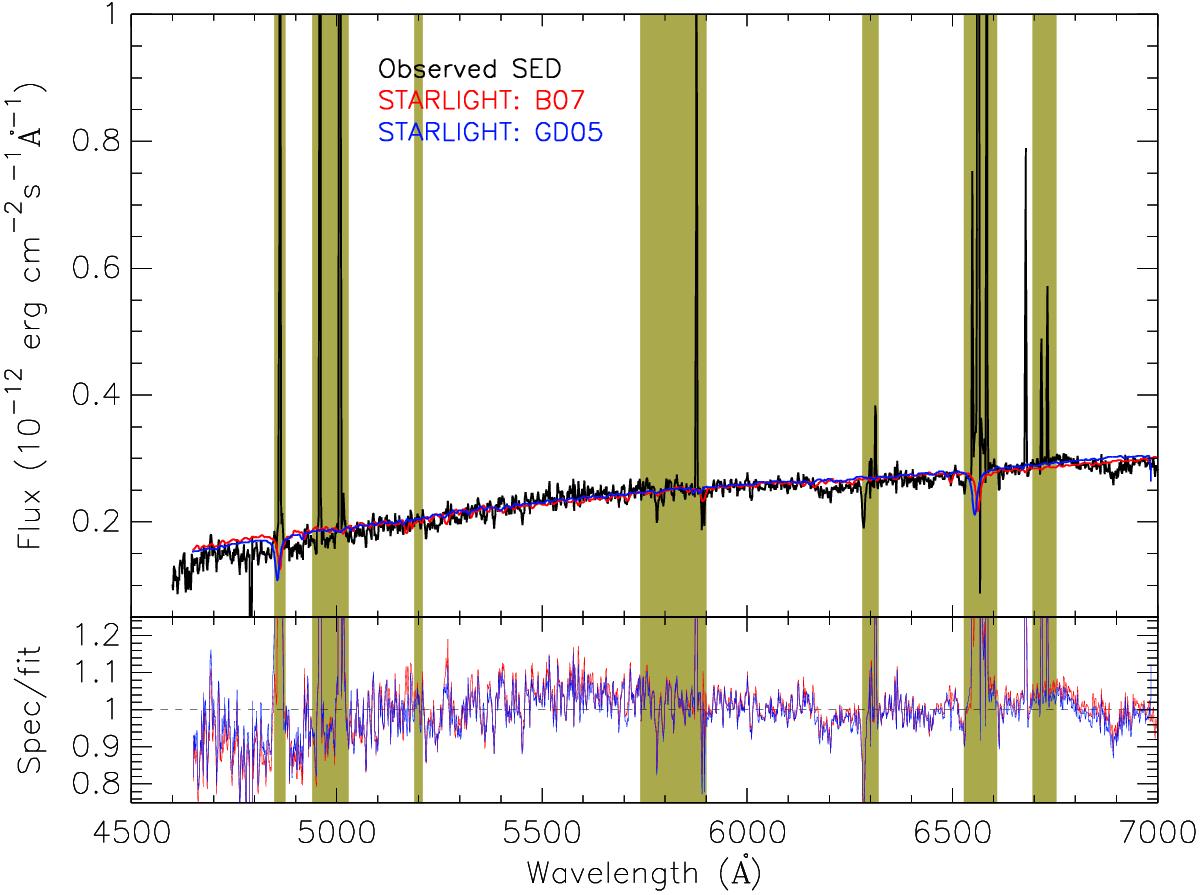
Result of the STARLIGHT fit using the SSP models from Bruzual (2007, red) and González Delgado et al. (2005, blue) compared to the integrated spectrum of NGC 3603 (black). Masked regions are shaded in dark yellow. Fit residuals are shown in the bottom panel. The horizontal dashed line indicates the ratio of unity between the observed spectrum and model fit.
Current usage metrics show cumulative count of Article Views (full-text article views including HTML views, PDF and ePub downloads, according to the available data) and Abstracts Views on Vision4Press platform.
Data correspond to usage on the plateform after 2015. The current usage metrics is available 48-96 hours after online publication and is updated daily on week days.
Initial download of the metrics may take a while.