Fig. 3
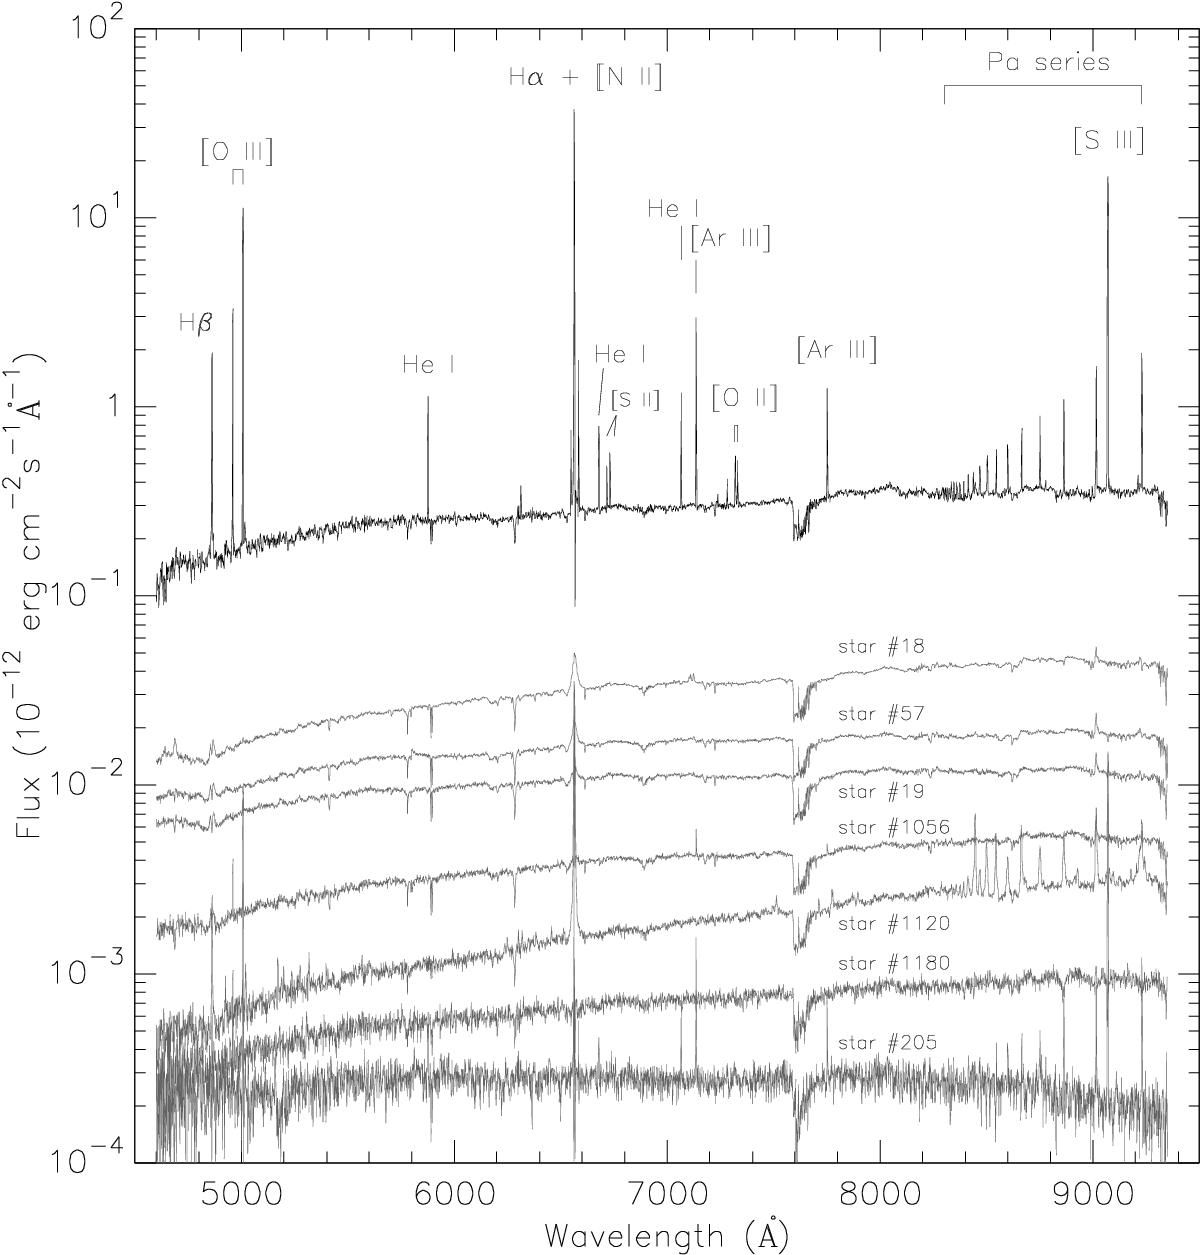
Observed integrated spectrum of NGC 3603 within the whole MUSE FoV (top; solid black line), plotted alongside a montage of spectra from several individual stars in the field (solid grey lines). The individual stars are identified with their respective identification numbers (see Fig. 2). The integrated spectrum is the sum of all the spaxels in the FoV and thus includes all the individual stellar spectra and the associated nebulosity. The strongest emission lines in the integrated spectrum are indicated. Spectra are wavelength and flux calibrated.
Current usage metrics show cumulative count of Article Views (full-text article views including HTML views, PDF and ePub downloads, according to the available data) and Abstracts Views on Vision4Press platform.
Data correspond to usage on the plateform after 2015. The current usage metrics is available 48-96 hours after online publication and is updated daily on week days.
Initial download of the metrics may take a while.