Free Access
Fig. 7
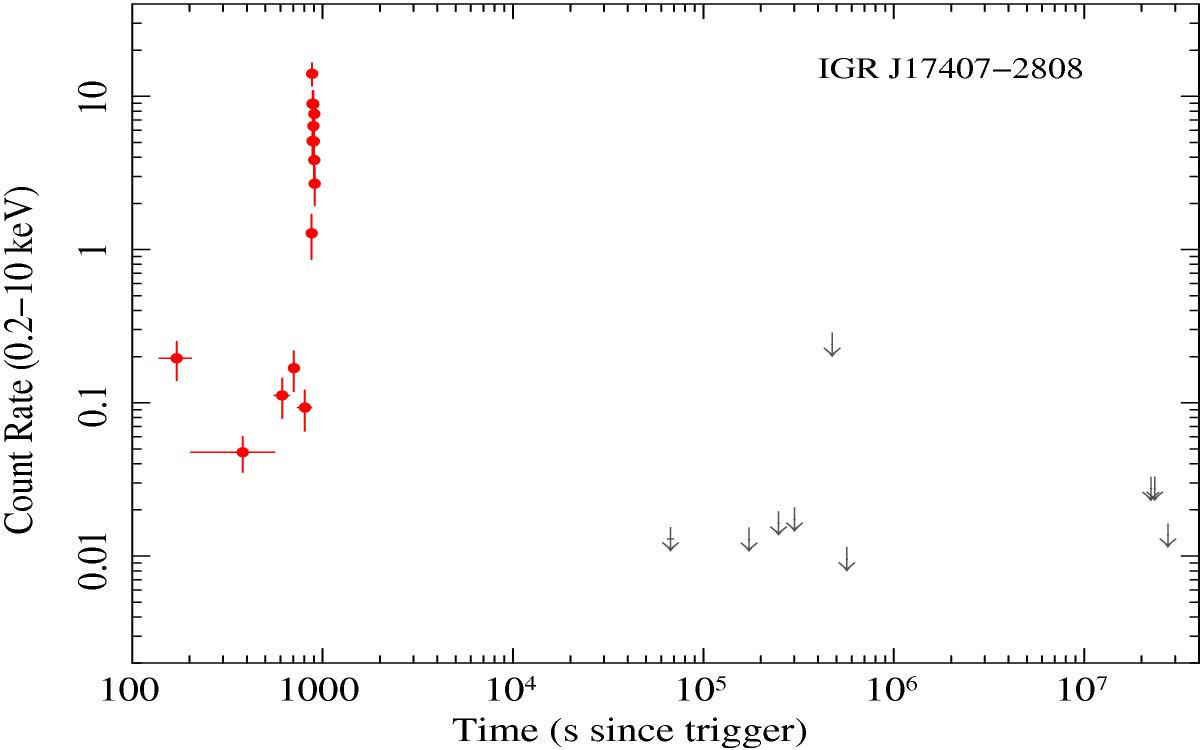
Light curve of the XRT dataset of IGR J17407−2808. Grey downward-pointing arrows correspond to the 3σ upper limits calculated for the source non-detections. Points after 107 s correspond to serendipitous observations.
Current usage metrics show cumulative count of Article Views (full-text article views including HTML views, PDF and ePub downloads, according to the available data) and Abstracts Views on Vision4Press platform.
Data correspond to usage on the plateform after 2015. The current usage metrics is available 48-96 hours after online publication and is updated daily on week days.
Initial download of the metrics may take a while.