Fig. 6
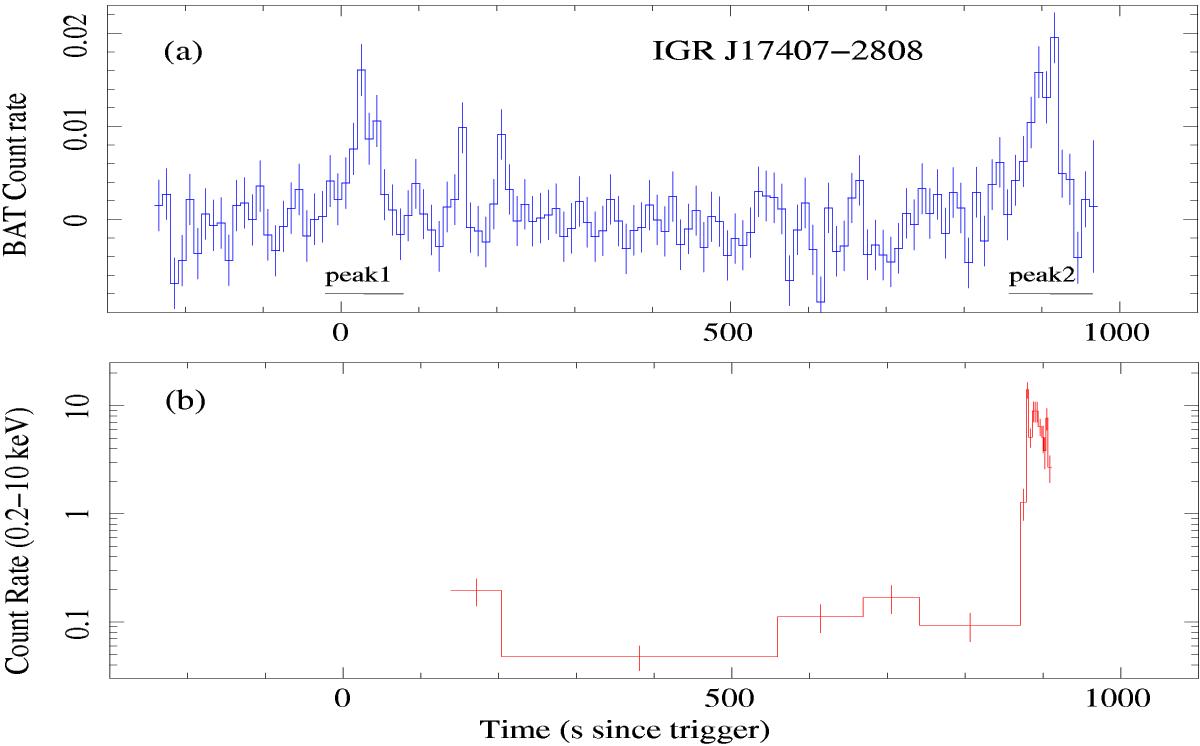
Light curves of the 2011 October 15 outburst of IGR J17407−2808 (first Swift orbit data). a) BAT light curve in the 14−50 keV energy band and a binning of 10 s. The horizontal lines mark the time intervals used for the spectral extraction (peak1 and peak2). b) The XRT light curve in the 0.2−10 keV energy band. An adaptive binning has been used to achieve in each point a signal-to-noise ratio of S/N = 3.
Current usage metrics show cumulative count of Article Views (full-text article views including HTML views, PDF and ePub downloads, according to the available data) and Abstracts Views on Vision4Press platform.
Data correspond to usage on the plateform after 2015. The current usage metrics is available 48-96 hours after online publication and is updated daily on week days.
Initial download of the metrics may take a while.