Free Access
Fig. 3
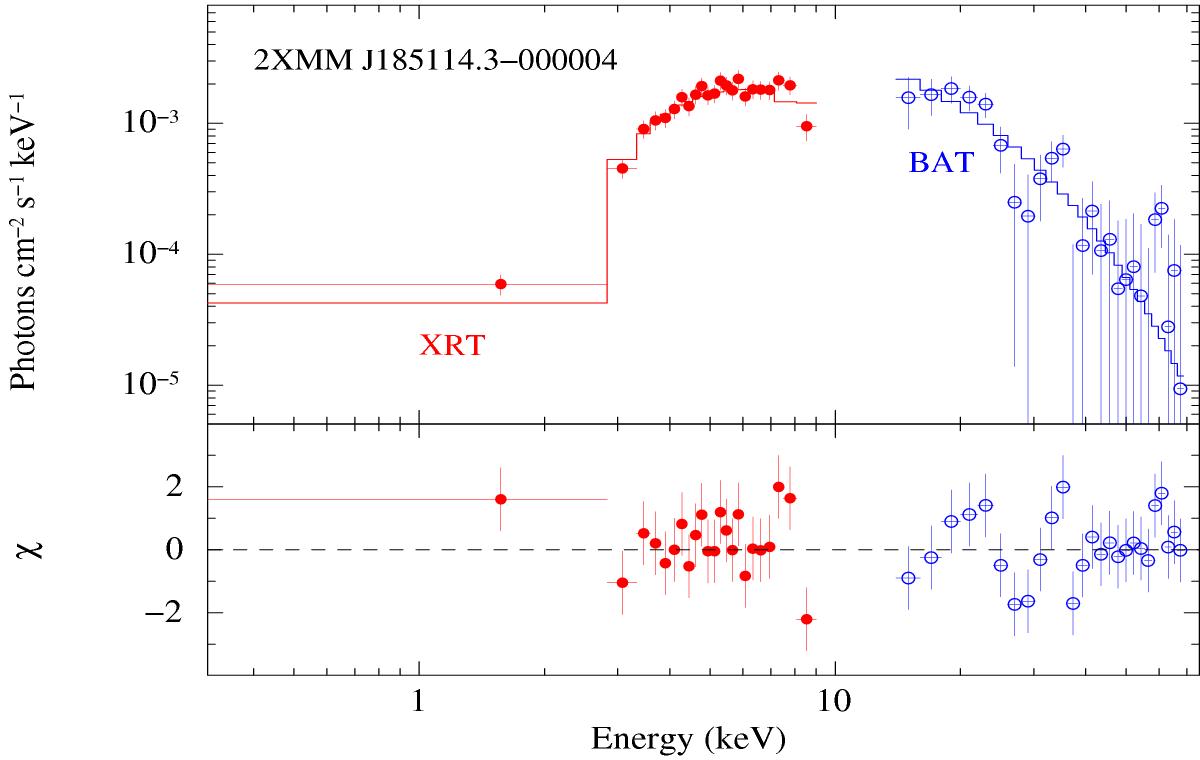
Spectroscopy of the 2012 June 17 outburst of 2XMM J185114.3−000004. The top panel shows simultaneous XRT/PC (filled red circles) and BAT data (empty blue circles) fit with a PHABS*CUTOFFPL model. The residuals from the best fit are shown in the bottom panel (in units of standard deviations).
Current usage metrics show cumulative count of Article Views (full-text article views including HTML views, PDF and ePub downloads, according to the available data) and Abstracts Views on Vision4Press platform.
Data correspond to usage on the plateform after 2015. The current usage metrics is available 48-96 hours after online publication and is updated daily on week days.
Initial download of the metrics may take a while.