Fig. 11
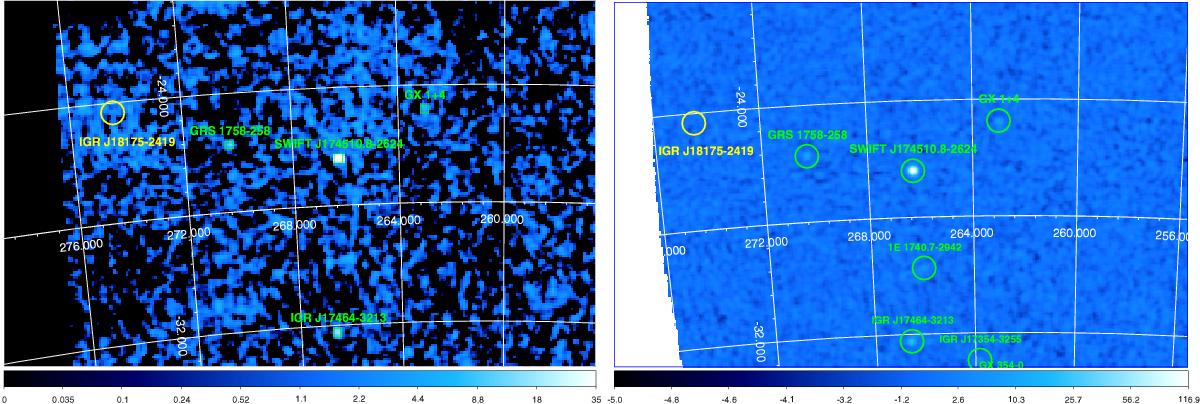
Left: IBIS/ISGRI mosaic extracted with the OSA software from the SCW 51 in revolution 1215 (20−80 keV energy band). We indicated (green squares) on the mosaic the position of 4 sources detected with a sufficiently high significance (SWIFT J174510.8−2624, GRS 1758−258, GX 1+4, IGR J17464−3213) and that previously reported for IGR J18175−2419. The latter is indicated by using a yellow circle with a radius of 24′ centred on the source best position provided by Grebenev (2013). Right: significance map obtained with the BATIMAGER software (Segreto et al. 2010a) in the 20−80 keV energy band for the SCW 51. Green circles (24′ radius) shows the positions of all sources significantly detected in the field, as well as the position of IGR J18175−2419, as reported by Grebenev (2013). In either mosaic, independently built with different software, we do not detect any significant emission from IGR J18175−2419. The bars at the bottom of each mosaic indicate the colour codes for the detection significances in units of standard deviations.
Current usage metrics show cumulative count of Article Views (full-text article views including HTML views, PDF and ePub downloads, according to the available data) and Abstracts Views on Vision4Press platform.
Data correspond to usage on the plateform after 2015. The current usage metrics is available 48-96 hours after online publication and is updated daily on week days.
Initial download of the metrics may take a while.