Free Access
Fig. 1
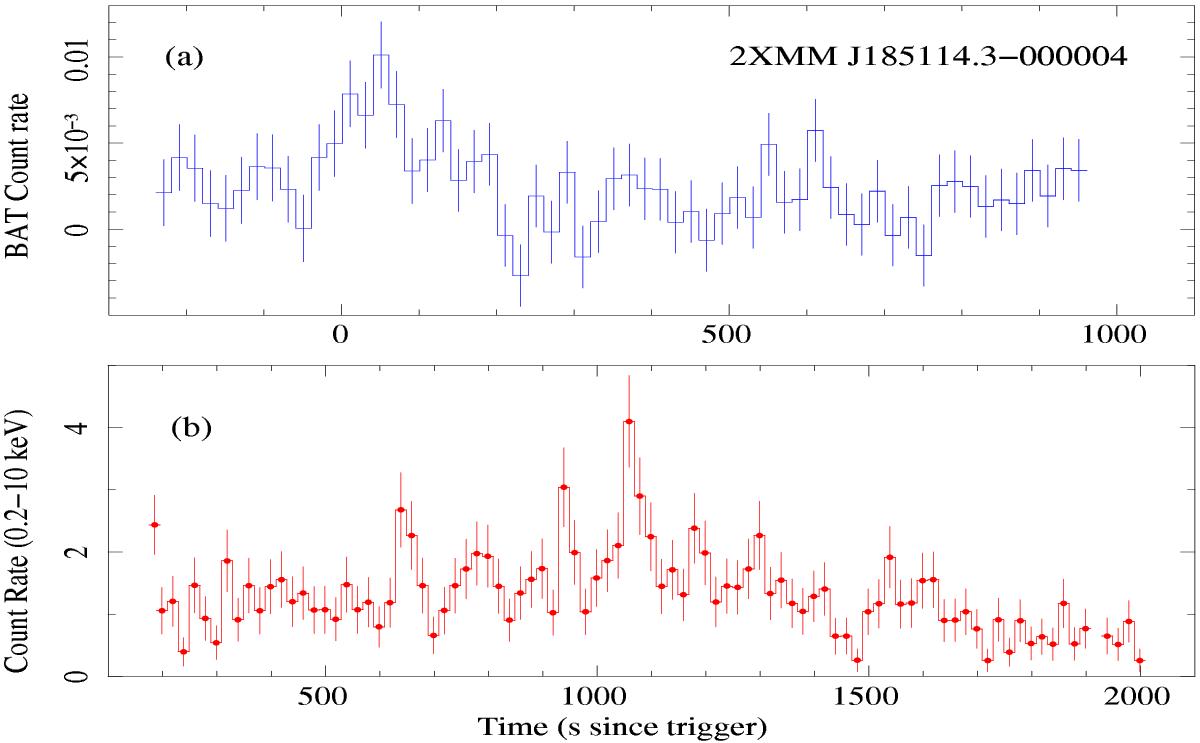
Light curves of the outburst in 2012 June 17 of 2XMM J185114.3−000004 (first Swift orbit data). a) BAT light curve in the 14−50 keV with a time binning of 20 s. b) XRT light curve in the 0.2−10keV, rebinned to have at least 10 counts bin-1. Note the different x-axis scales.
Current usage metrics show cumulative count of Article Views (full-text article views including HTML views, PDF and ePub downloads, according to the available data) and Abstracts Views on Vision4Press platform.
Data correspond to usage on the plateform after 2015. The current usage metrics is available 48-96 hours after online publication and is updated daily on week days.
Initial download of the metrics may take a while.