Free Access
Fig. 8
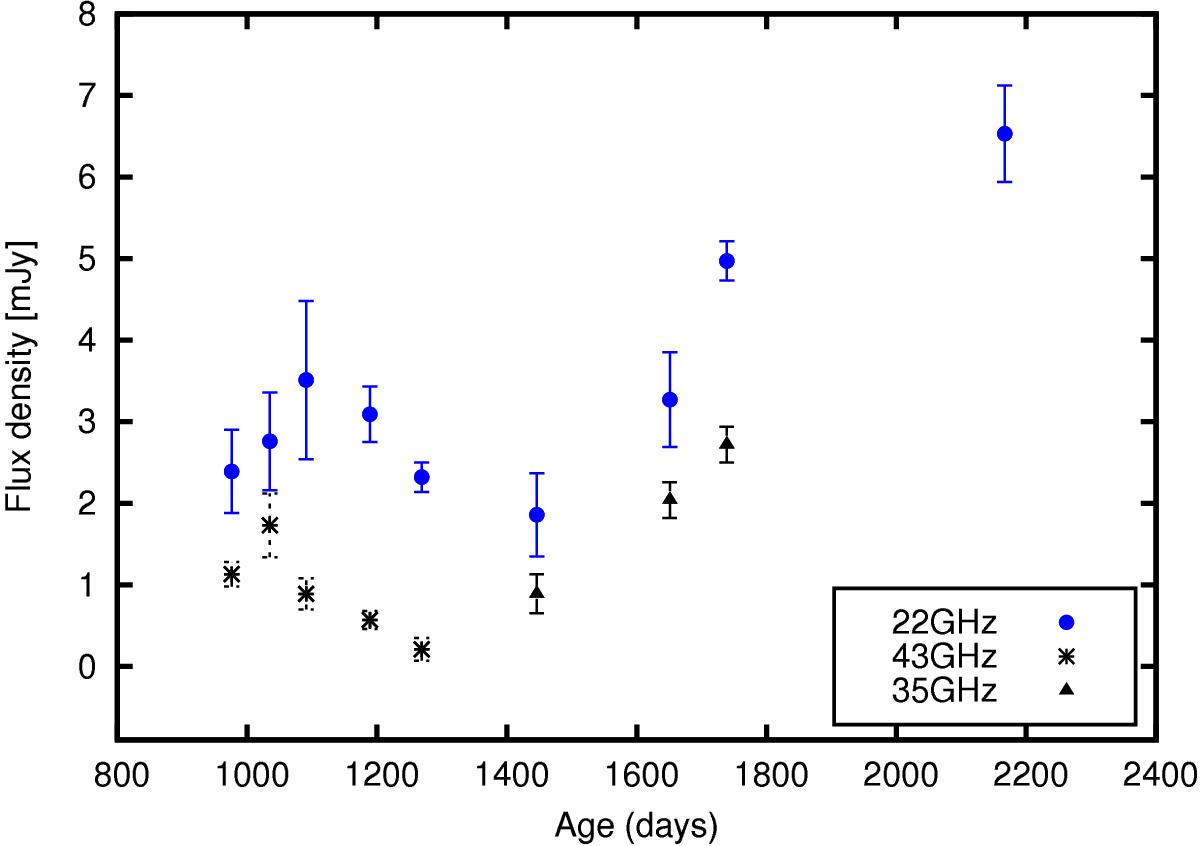
Zoom into our higher frequency light-curve for a period between t = 800 to t = 2400 days. The flux density enhancement at t ≥ 1400 days was detected in both VLA and VLBI results at all frequencies.
Current usage metrics show cumulative count of Article Views (full-text article views including HTML views, PDF and ePub downloads, according to the available data) and Abstracts Views on Vision4Press platform.
Data correspond to usage on the plateform after 2015. The current usage metrics is available 48-96 hours after online publication and is updated daily on week days.
Initial download of the metrics may take a while.