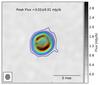
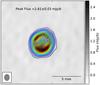
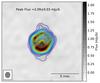
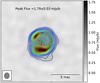
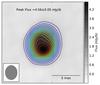
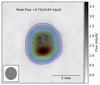
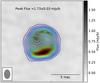
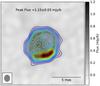
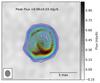
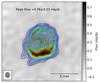
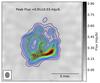
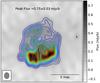
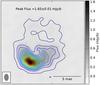
Fig. 6

Natural weighted VLBI images of the expanding shell produced by supernova SN 2008iz at 4.8 GHz. They cover the observation periods between 2009 October and 2013 January as summarized in Table A.2. The figures show the 4.8 GHz linear grey-scale images overlaid with their contour maps that scale to the peak intensity at each epoch (listed in each panel). All image contours correspond to 6% of the peak intensity (lowest contour) and subsequent increases by 6%. The images have been convolved with the natural weighting beam, shown in the bottom left corner of each panel.

Current usage metrics show cumulative count of Article Views (full-text article views including HTML views, PDF and ePub downloads, according to the available data) and Abstracts Views on Vision4Press platform.
Data correspond to usage on the plateform after 2015. The current usage metrics is available 48-96 hours after online publication and is updated daily on week days.
Initial download of the metrics may take a while.