Fig. 4
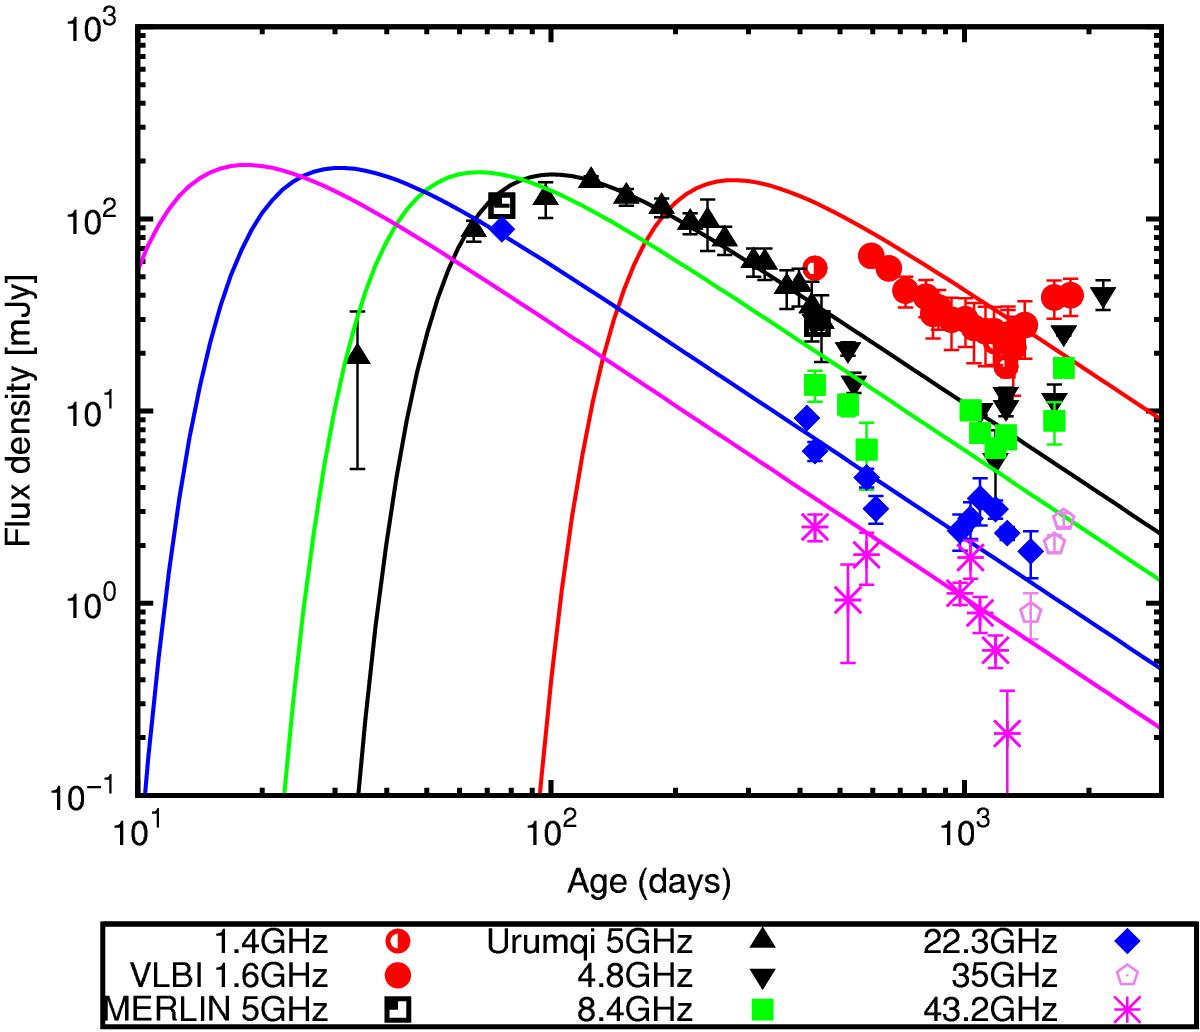
Multi-frequency light curve of SN 2008iz. The MERLIN 5 GHz data were taken from Beswick et al. (2009) and the Urumqi 5 GHz from Marchili et al. (2010). The remaining data are tabulated in Tables A.1 and A.2. The black line represents a Weiler model fit to 5 GHz data obtained by Marchili et al. (2010) with the Urumqi telescope. The other lines represent light curves calculated using the equations in the text for the other frequency data sets as colour coded in the legend.
Current usage metrics show cumulative count of Article Views (full-text article views including HTML views, PDF and ePub downloads, according to the available data) and Abstracts Views on Vision4Press platform.
Data correspond to usage on the plateform after 2015. The current usage metrics is available 48-96 hours after online publication and is updated daily on week days.
Initial download of the metrics may take a while.