Fig. 3
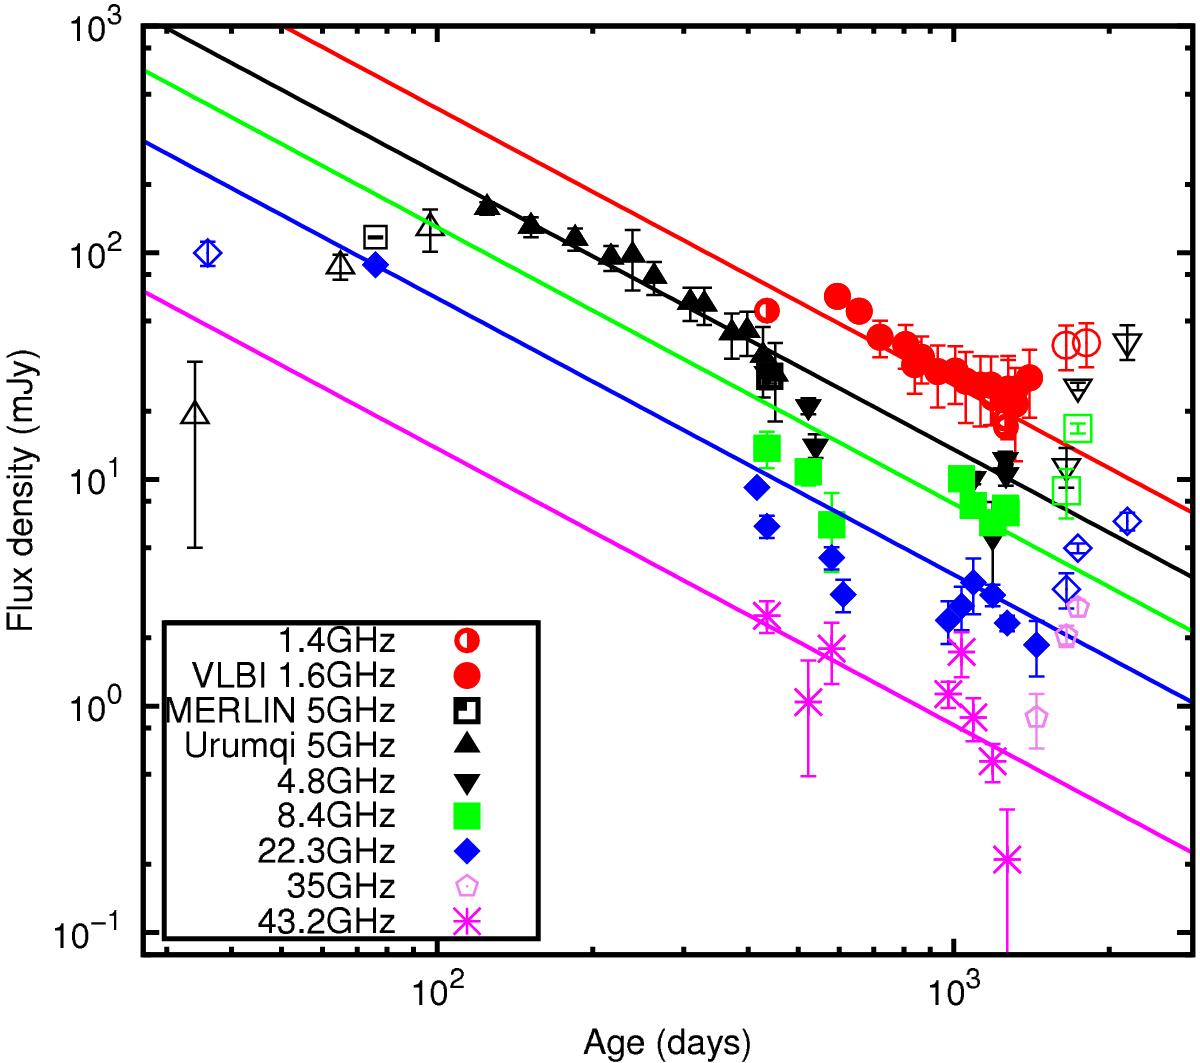
Combined multi-frequency light curve for the optically thin regime of SN 2008iz. The fitted data are shown as filled symbols, while the data not used to fit are shown as open symbols. The data sources are indicated in Fig. 1, while the 1.6 GHz VLBI data are tabulated in Table A.2.The lines represent simple power-law fits to the data at the different frequencies as colour coded in the legend.
Current usage metrics show cumulative count of Article Views (full-text article views including HTML views, PDF and ePub downloads, according to the available data) and Abstracts Views on Vision4Press platform.
Data correspond to usage on the plateform after 2015. The current usage metrics is available 48-96 hours after online publication and is updated daily on week days.
Initial download of the metrics may take a while.