Fig. 7
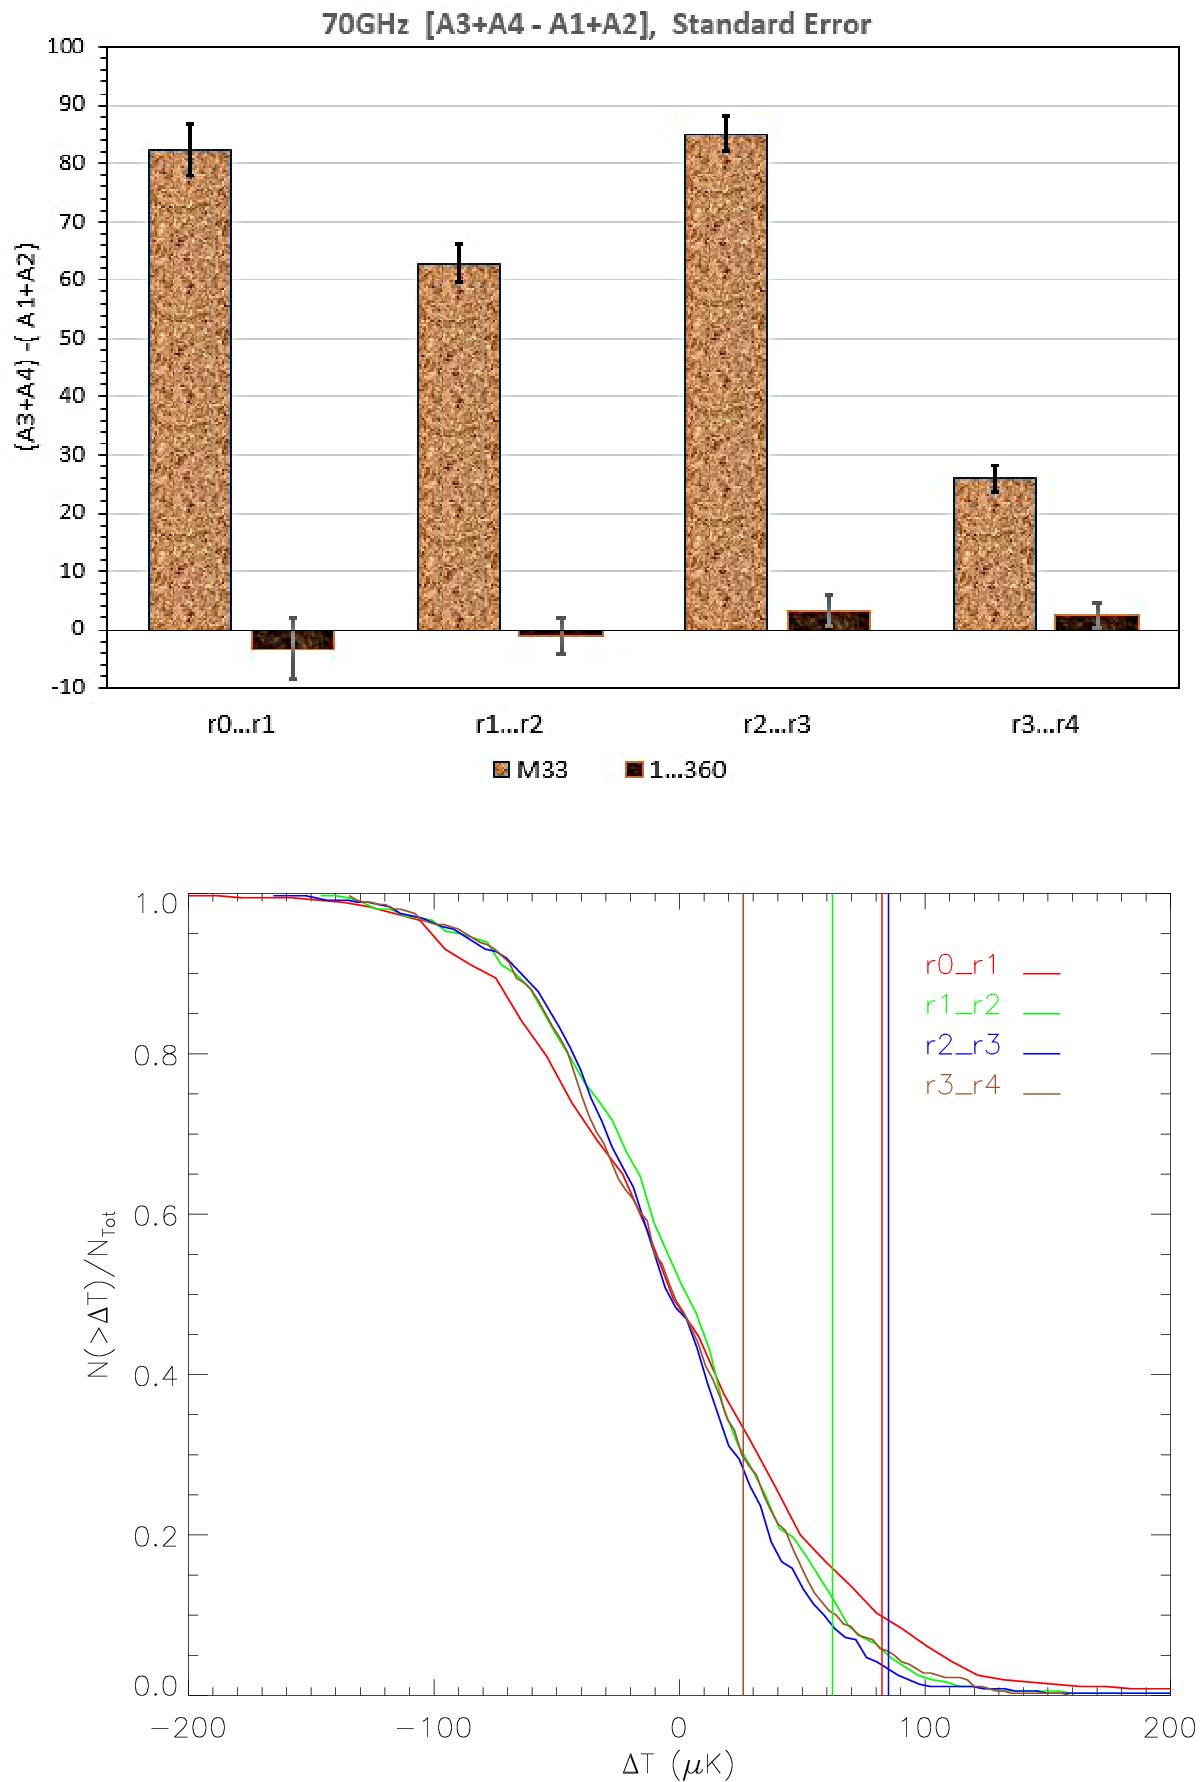
Upper panel: temperature asymmetry in μK, in the 70 GHz Planck band, of regions A3 and A4 compared with regions A1 and A2 in four annuli around M 33 (light brown histograms). The dark brown histograms depict the mean ΔT value of the 360 control fields with the corresponding standard error of the mean. Bottom panel: cumulative distribution of the 360 control field temperature asymmetry in the four regions in the upper panel. The vertical lines show the temperature asymmetry value toward M 33 for each considered region.
Current usage metrics show cumulative count of Article Views (full-text article views including HTML views, PDF and ePub downloads, according to the available data) and Abstracts Views on Vision4Press platform.
Data correspond to usage on the plateform after 2015. The current usage metrics is available 48-96 hours after online publication and is updated daily on week days.
Initial download of the metrics may take a while.