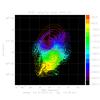
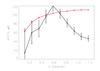
Fig. 5
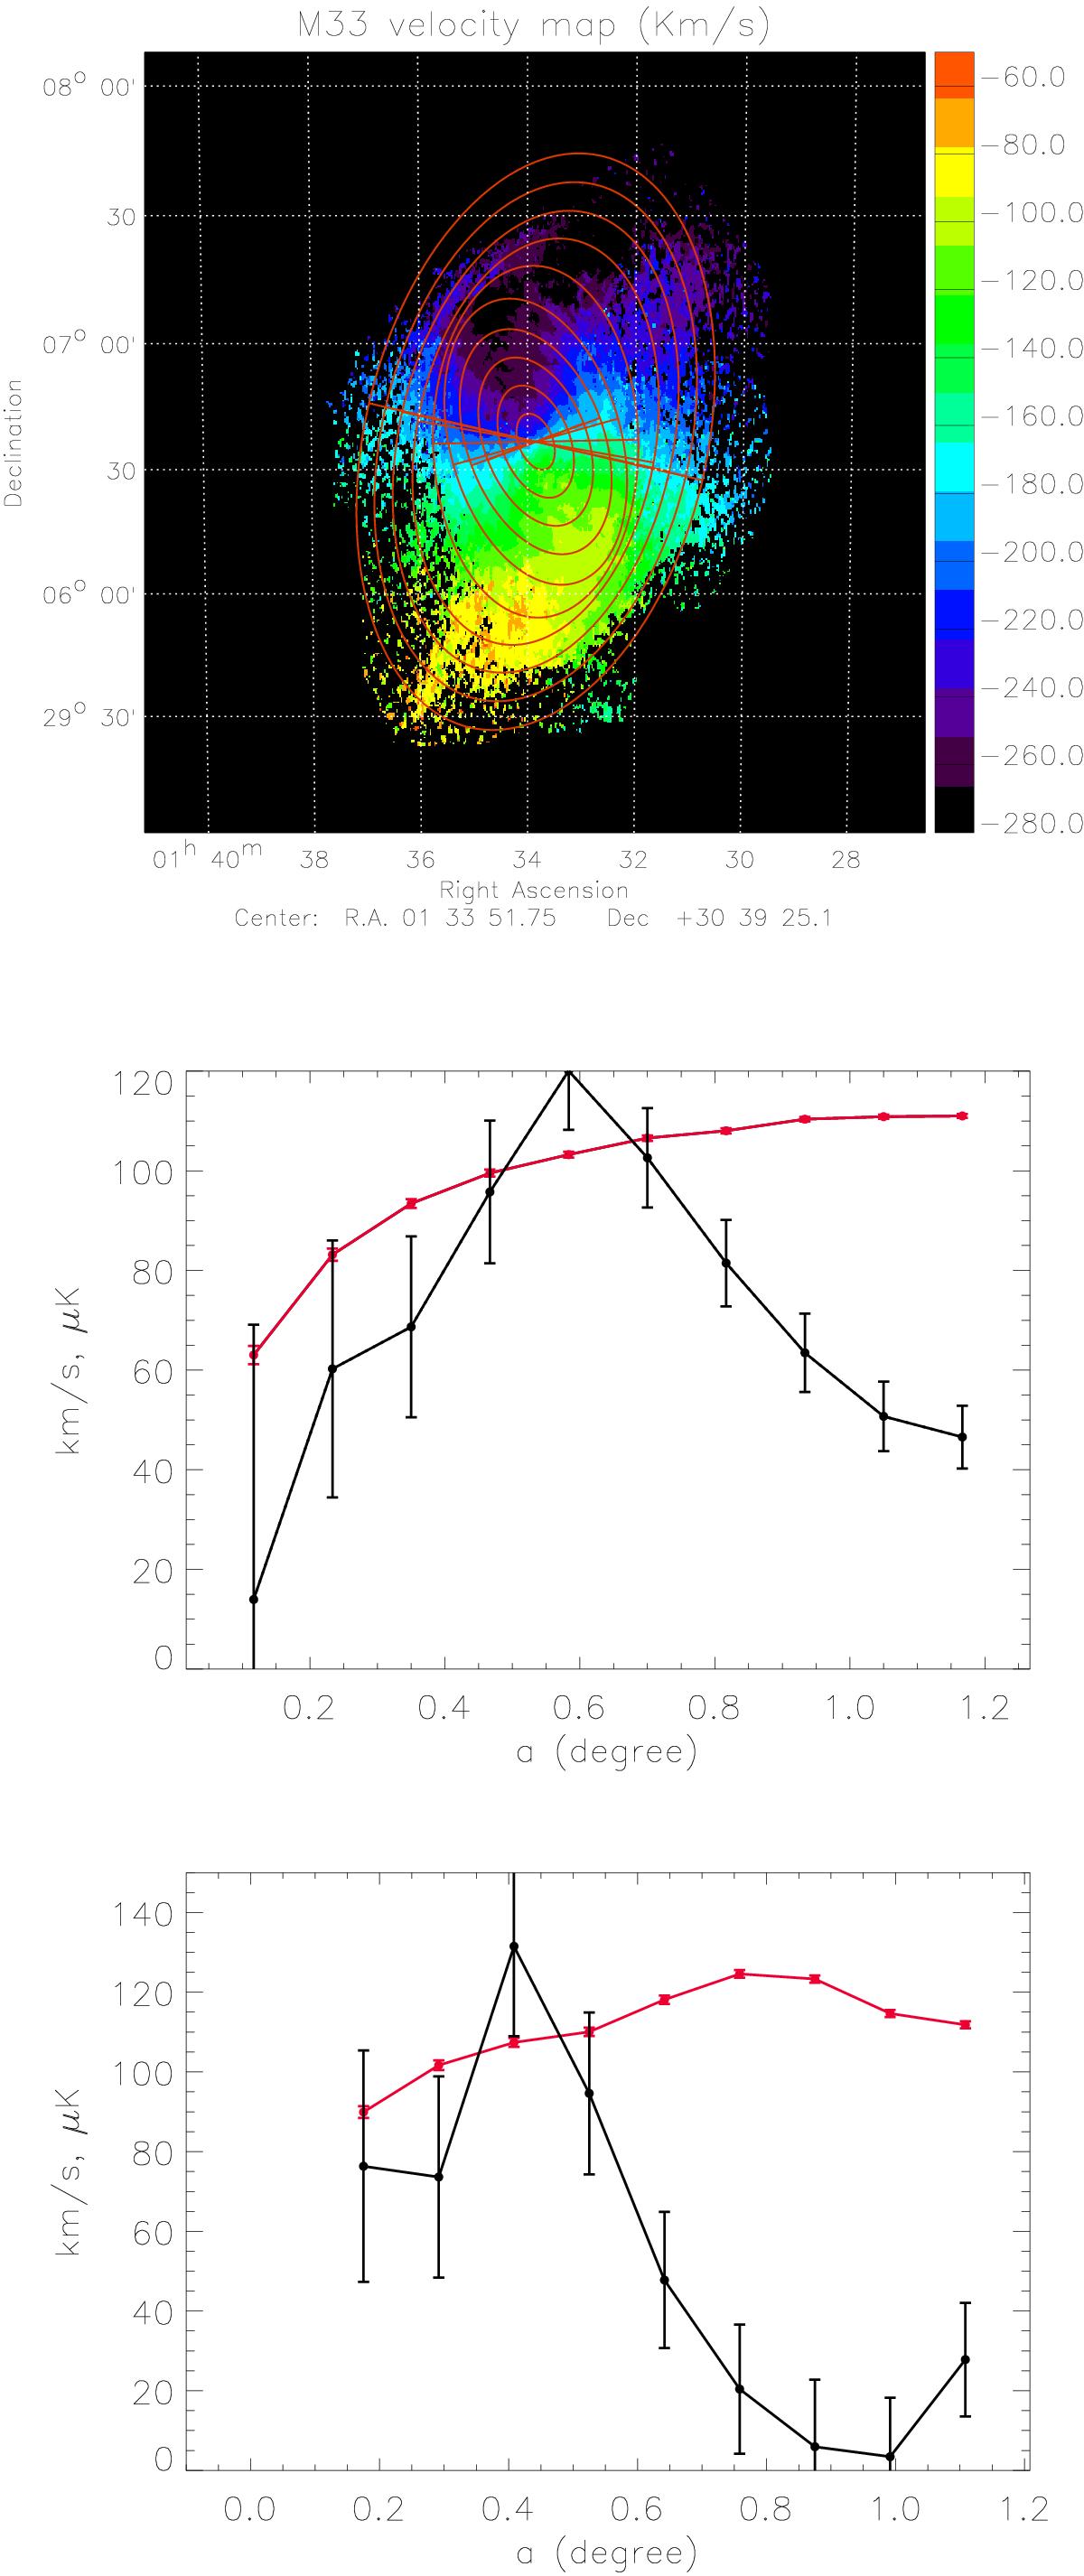
Upper panel: considered ellipse geometry from the model in Corbelli & Schneider (1997) superposed on the HI velocity field at 21 cm of the M 33 galaxy (from Chemin et al. 2012). For each ellipse we also show the minor axis with respect to which the temperature asymmetry and HI velocity are calculated. Median panel: radial profile, in μK, for the temperature asymmetry in the 70 GHz Planck band (black curve) and for the 21 cm DRAO data relative to the M 33 HI velocity field (red profile). The points in the horizontal axis show the central value in degrees of the semi-major axes of two adjacent ellipses (i.e., (ai + ai + 1) / 2). Bottom panel: temperature and velocity radial profiles, but with the temperature and velocity asymmetry calculated shell by shell.
Current usage metrics show cumulative count of Article Views (full-text article views including HTML views, PDF and ePub downloads, according to the available data) and Abstracts Views on Vision4Press platform.
Data correspond to usage on the plateform after 2015. The current usage metrics is available 48-96 hours after online publication and is updated daily on week days.
Initial download of the metrics may take a while.