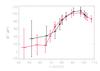
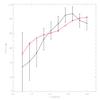
Fig. 4
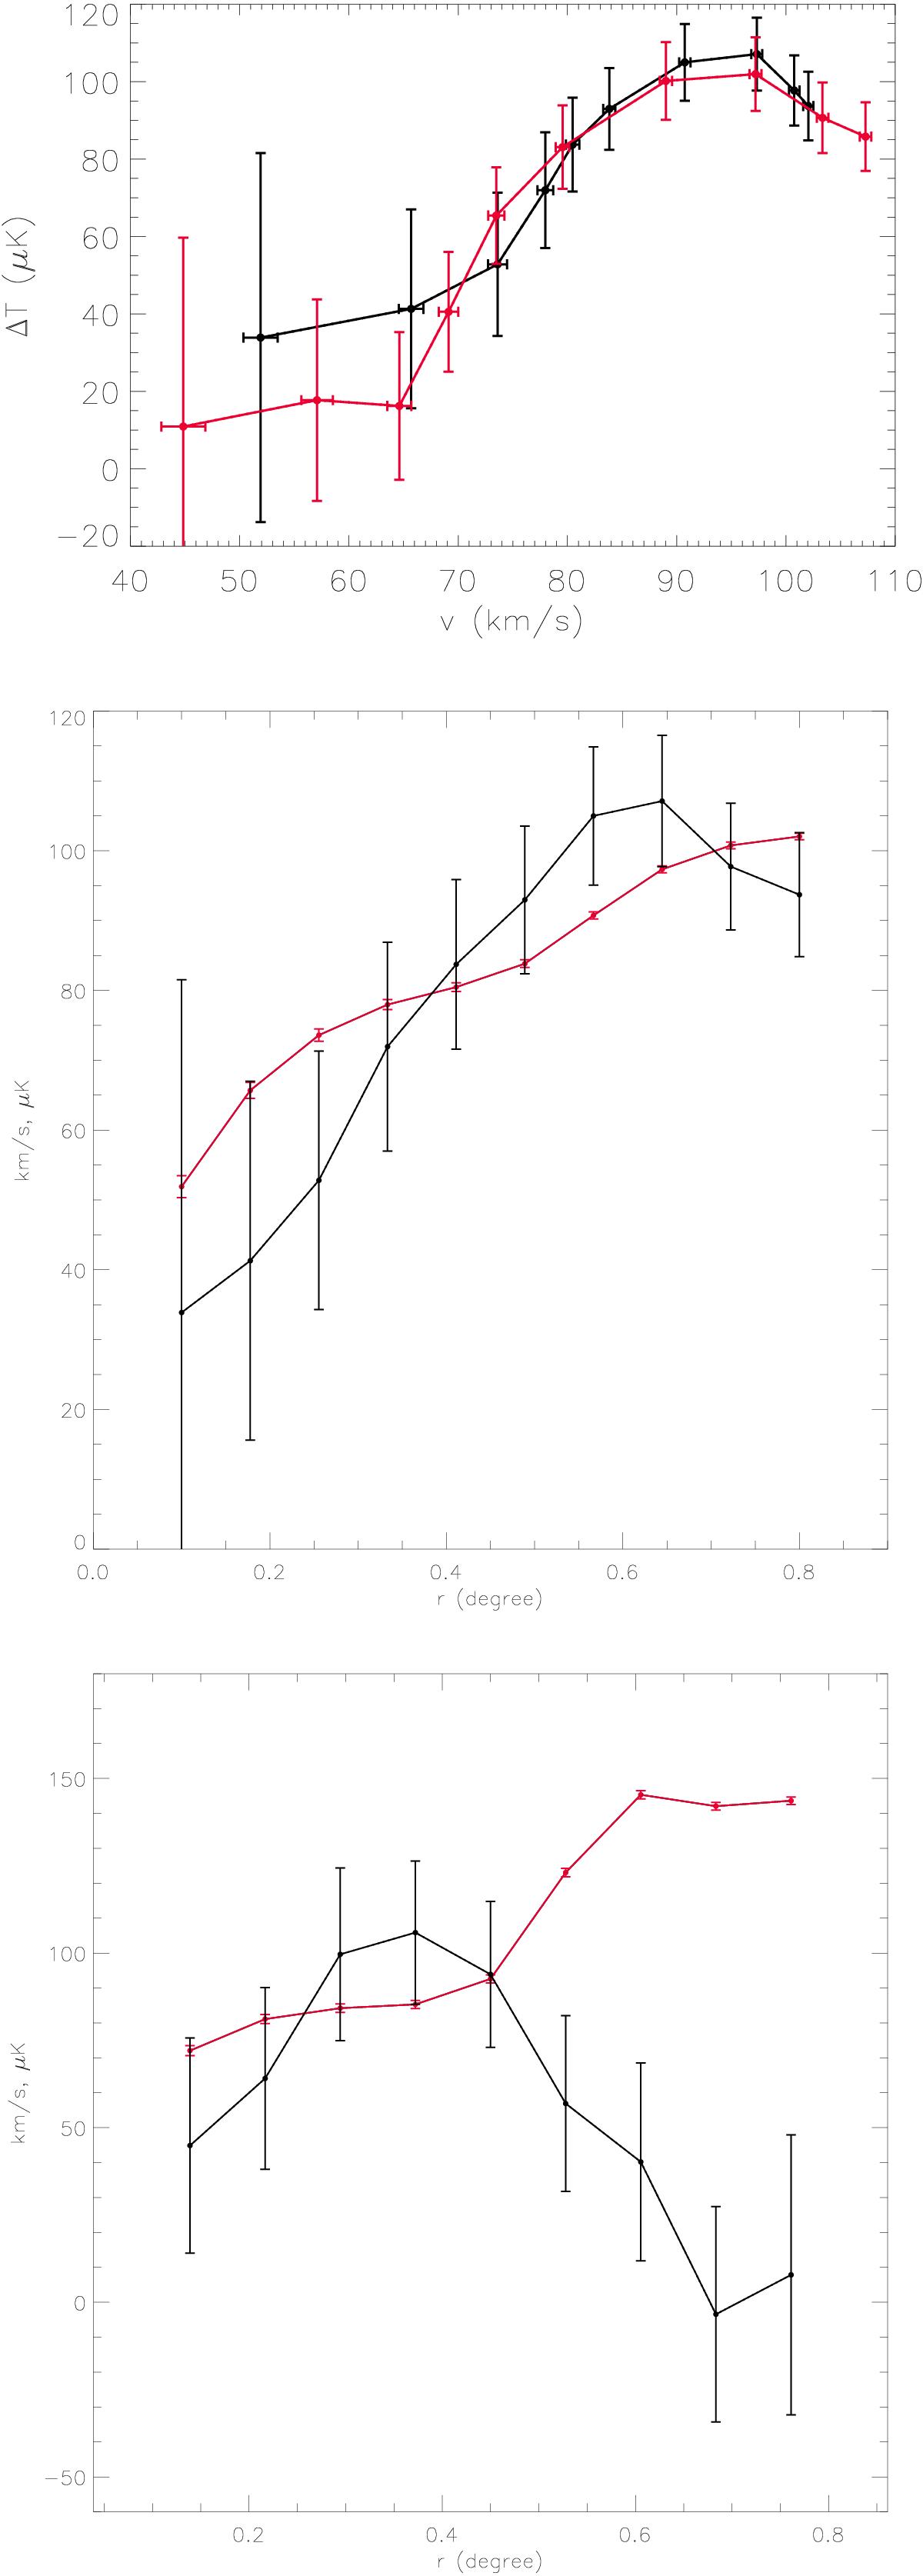
Upper panel: correlation of the temperature asymmetry with respect to the 21 cm velocity field within ten ellipses with major axes between 0.1° and 0.8° (black line) and for the ellipse with position angle rotated by 34° (red line). Central panel: radial profile, in μK for the temperature asymmetry in the 70 GHz Planck band (black curve) and for the 21 cm DRAO data relative to the M 33 HI velocity field (red profile, in km s-1) in Fig. 3. Bottom panel: temperature and velocity radial profiles, but with the temperature and velocity asymmetry calculated shell by shell.
Current usage metrics show cumulative count of Article Views (full-text article views including HTML views, PDF and ePub downloads, according to the available data) and Abstracts Views on Vision4Press platform.
Data correspond to usage on the plateform after 2015. The current usage metrics is available 48-96 hours after online publication and is updated daily on week days.
Initial download of the metrics may take a while.