Fig. 3
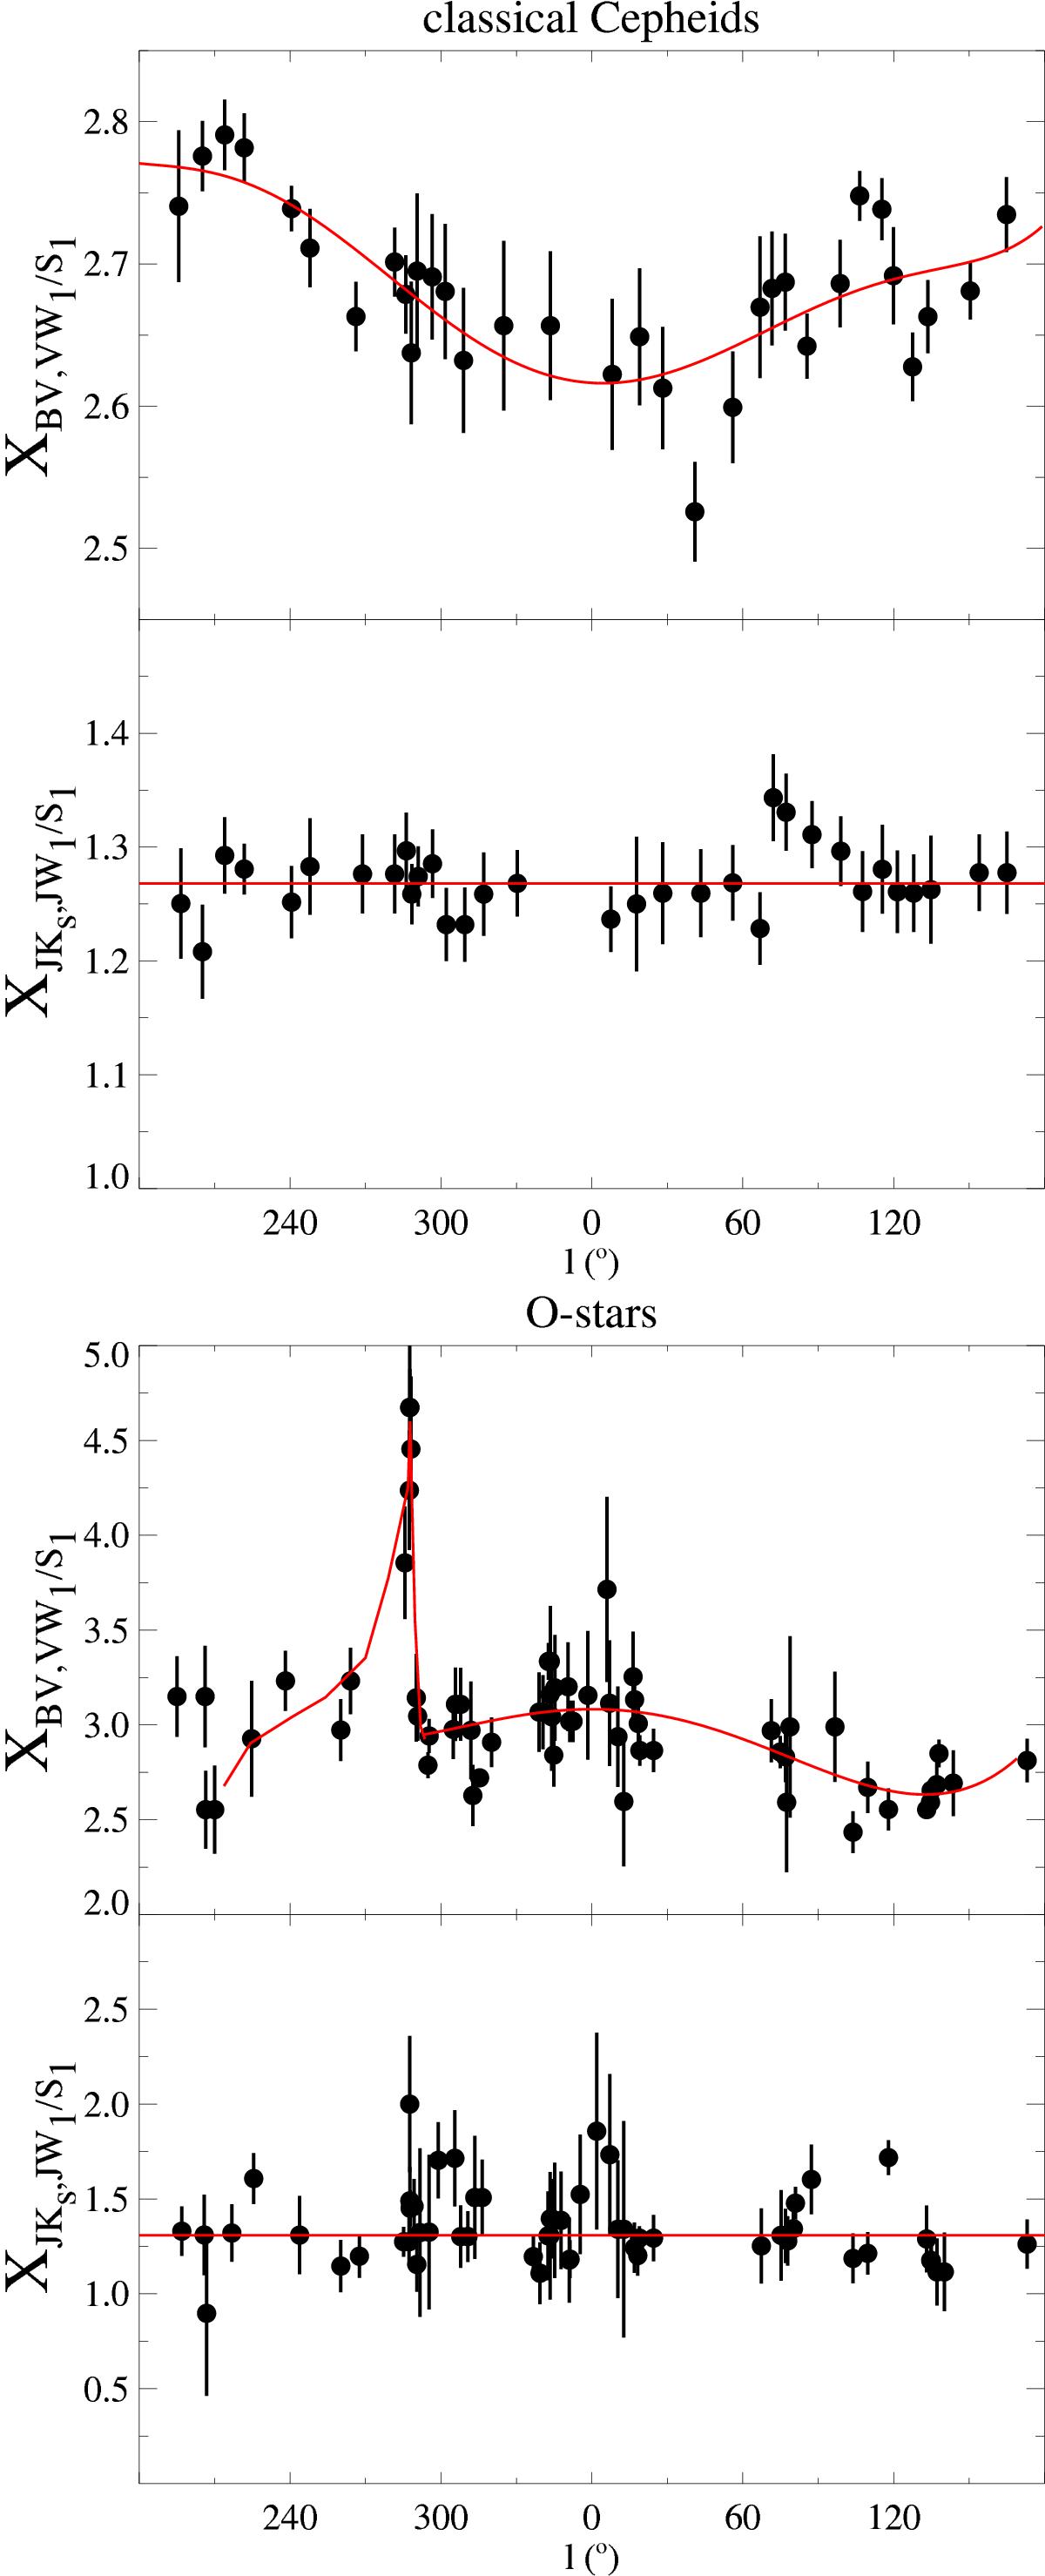
Optical color-excess ratios vary as a function of the Galactic sight line (top panels), in relative contrast to those tied solely to infrared photometry (e.g., ![]() , bottom panels). Classical Cepheids and O stars display different optical trends with extrema along separate sight lines. The binned results were overlaid with arbitrary (running mean and polynomial) fits to highlight the variations.
, bottom panels). Classical Cepheids and O stars display different optical trends with extrema along separate sight lines. The binned results were overlaid with arbitrary (running mean and polynomial) fits to highlight the variations.
Current usage metrics show cumulative count of Article Views (full-text article views including HTML views, PDF and ePub downloads, according to the available data) and Abstracts Views on Vision4Press platform.
Data correspond to usage on the plateform after 2015. The current usage metrics is available 48-96 hours after online publication and is updated daily on week days.
Initial download of the metrics may take a while.