Fig. 9
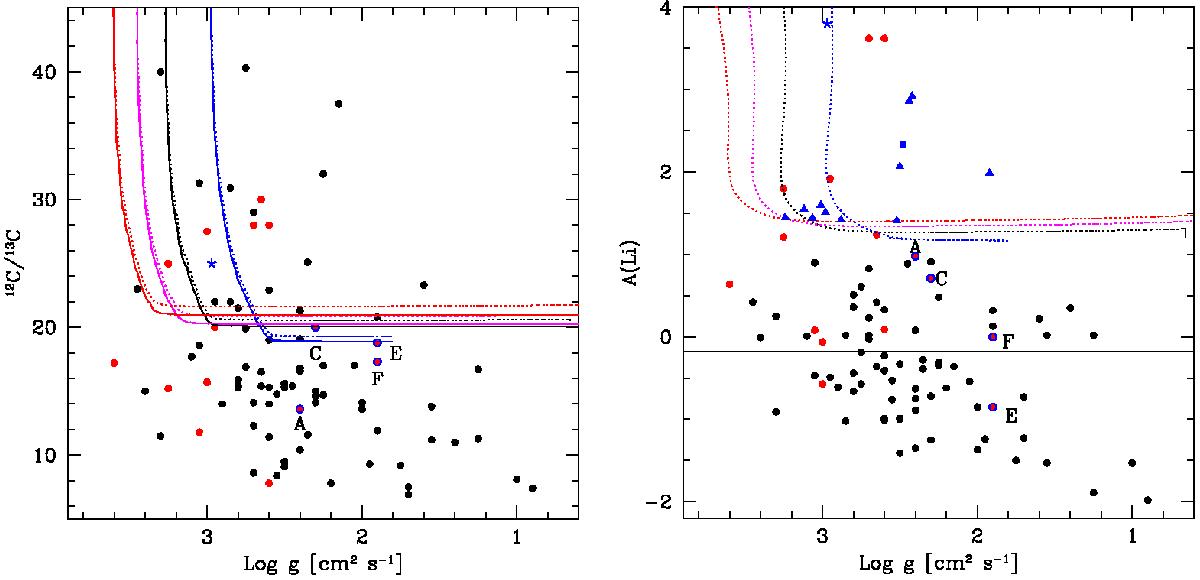
Comparison between surface abundances and theoretical predictions. The points are observations (see caption of Fig. 8 for the meaning of the different symbols). Left panel: surface isotopic ratios 12C/13C vs. surface gravities. The continuous lines are the same evolutionary tracks as those shown in the left panel of Fig. 8. The dotted lines show the new isotopic ratios obtained when account is made for the dilution in the convective envelope of the planet material (see text for more details) starting from the models with Ωini/ Ωcrit = 0.5. Right panel: surface lithium abundance vs. surface gravities. The continuous (black) horizontal line shows the averaged lithium abundance observed at the surface of stars with υsini smaller than 8 km s-1. The dotted lines show the results of dilution of the planet material into the convective envelope.
Current usage metrics show cumulative count of Article Views (full-text article views including HTML views, PDF and ePub downloads, according to the available data) and Abstracts Views on Vision4Press platform.
Data correspond to usage on the plateform after 2015. The current usage metrics is available 48-96 hours after online publication and is updated daily on week days.
Initial download of the metrics may take a while.