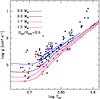
Fig. 8
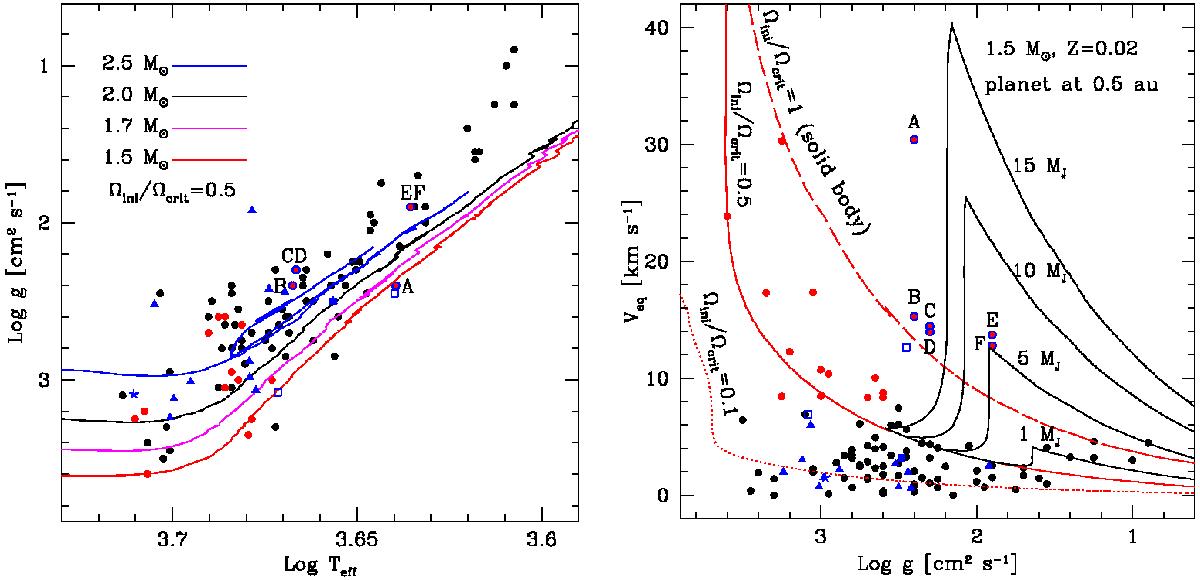
Left panel: surface gravities vs. effective temperatures. The continuous lines correspond to evolutionary tracks for single star models (no engulfment) for (from bottom to top) 1.5 (red), 1.7 (magenta), 2.0 (black), and 2.5 M⊙ (blue), starting with an initial angular velocity equal to 50% of the critical velocity. The dots show the observations by Carlberg et al. (2012), the black circles are for stars with υsini< 8 km s-1, the filled red and circled blue magenta points are for stars with υsini> 8 km s-1. The velocities of the circled blue magenta points cannot be explained by any reasonable model for single stars. The high rotation of these stars results with great probability from an interaction with an additional body. These points are labelled by letters (see text). The filled blue triangles are observations by Adamów et al. (2014), the filled blues square is the Li-rich star BD+48 740 discussed by Adamów et al. (2012a), and the blue star is the super Li-rich giant HD 107028 studied by Adamów et al. (2015). The two empty squares correspond to fast rotators obtained by Tayar et al. (2015) for stars with masses equal to 1.43 and 2.07 M⊙ along the red giant branch. Right panel: surface equatorial rotation vs. surface gravities for 1.5 M⊙ models. The two red tracks correspond to no planet engulfment cases starting with different initial rotations. The black curves show the evolution for stars with planet engulfment. The dots are the same observations as those shown in the left panel.
Current usage metrics show cumulative count of Article Views (full-text article views including HTML views, PDF and ePub downloads, according to the available data) and Abstracts Views on Vision4Press platform.
Data correspond to usage on the plateform after 2015. The current usage metrics is available 48-96 hours after online publication and is updated daily on week days.
Initial download of the metrics may take a while.