Fig. 7
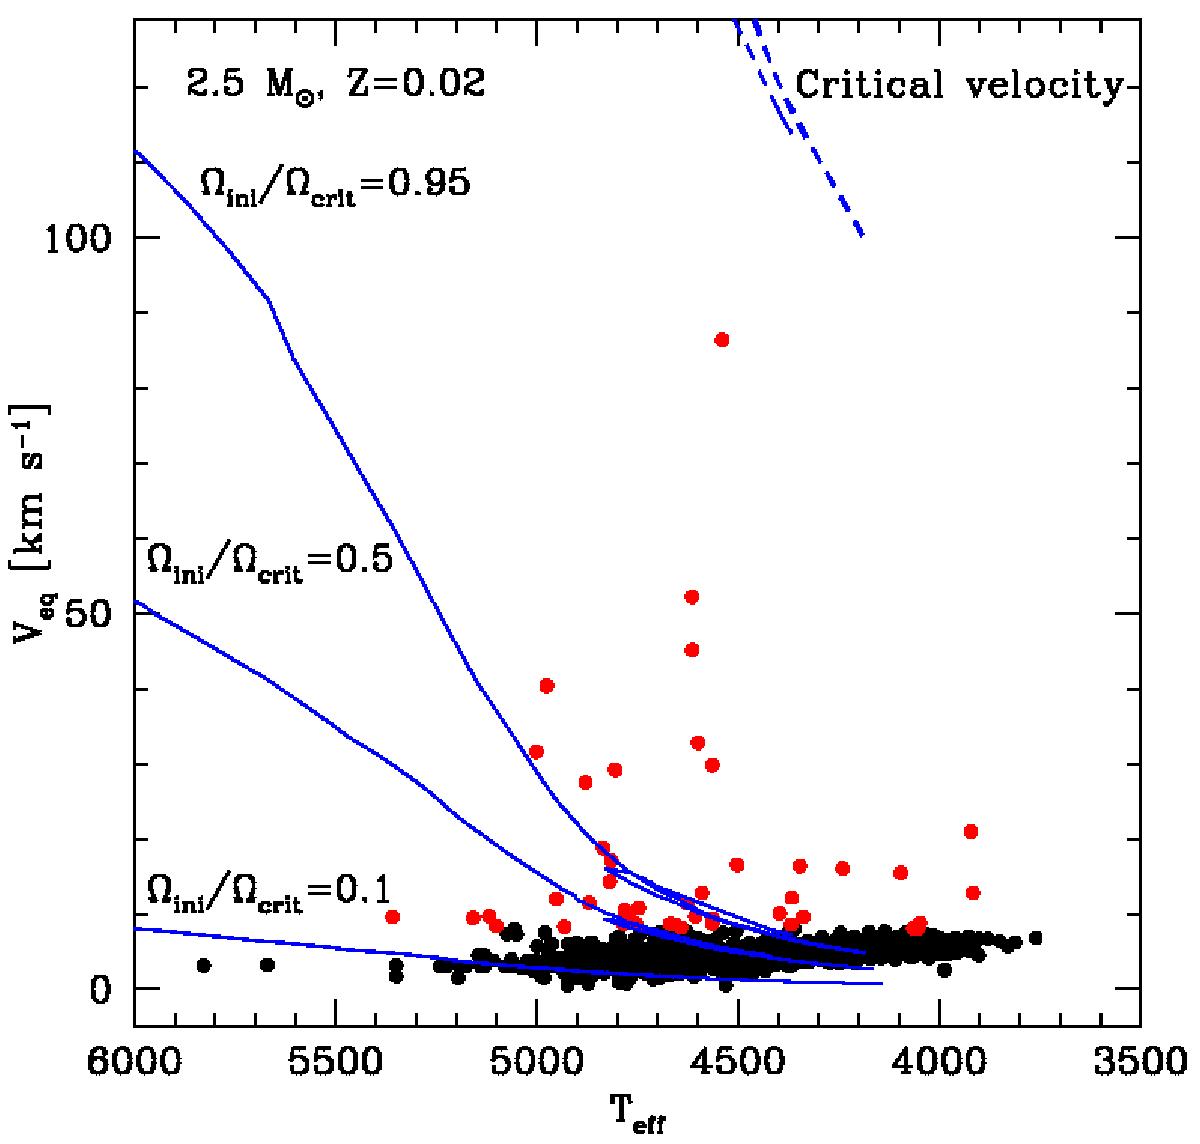
Surface velocities υsini as a function of the effective temperature for the sample of red giants observed by Carlberg et al. (2011). The red dots correspond to stars with υsini larger than 8 km s-1. The lines indicate the evolutionary tracks for 2.5 M⊙ stellar models for different initial rotations (from bottom to top, the time-averaged velocities during the MS phases are ~20, 100, and 280 km s-1). The upper dotted line shows the critical velocity.
Current usage metrics show cumulative count of Article Views (full-text article views including HTML views, PDF and ePub downloads, according to the available data) and Abstracts Views on Vision4Press platform.
Data correspond to usage on the plateform after 2015. The current usage metrics is available 48-96 hours after online publication and is updated daily on week days.
Initial download of the metrics may take a while.