Free Access
Fig. 2
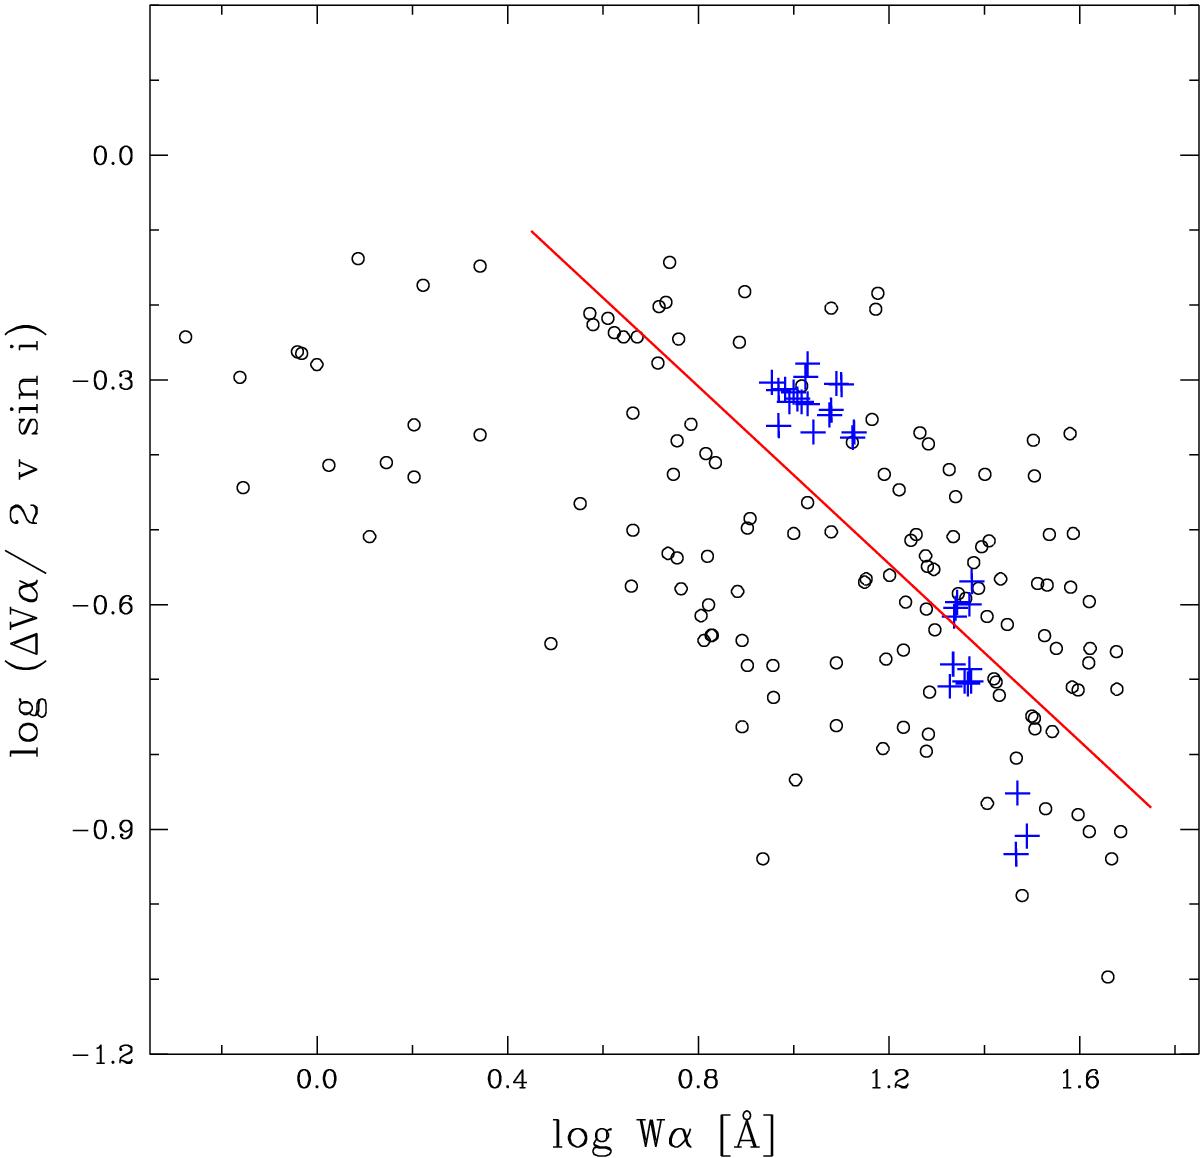
Distance between the peaks of Hα emission line (normalized with stellar rotation and inclination) versus Wα on a logarithmic scale. Black empty circles indicate normal Be stars, red pluses indicate Be /γ-ray binaries. The solid line denotes y = −0.592x + 0.165 (see Sect. 4.3).
Current usage metrics show cumulative count of Article Views (full-text article views including HTML views, PDF and ePub downloads, according to the available data) and Abstracts Views on Vision4Press platform.
Data correspond to usage on the plateform after 2015. The current usage metrics is available 48-96 hours after online publication and is updated daily on week days.
Initial download of the metrics may take a while.