Fig. 3
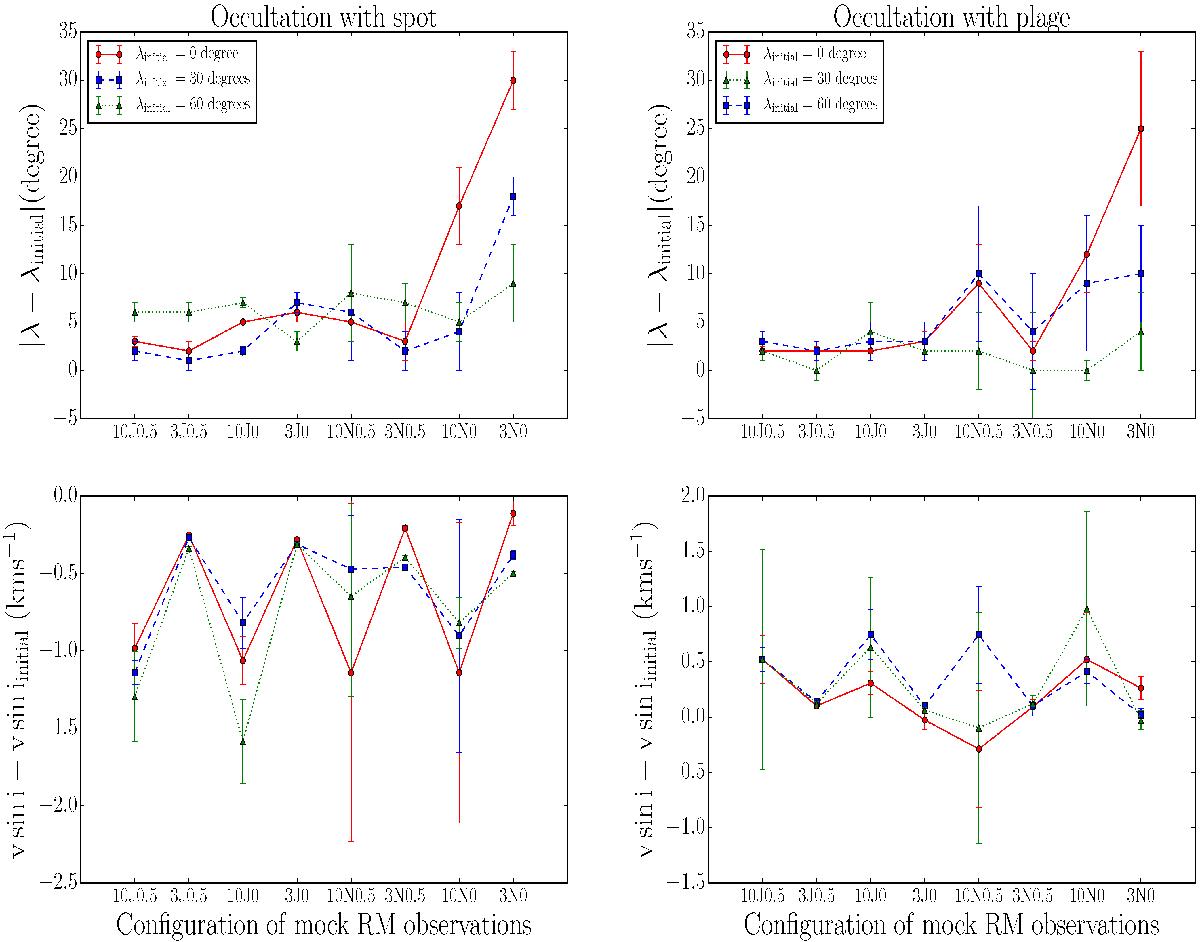
Top left: deviation of the estimated value of spin-orbit angle (obtained from the best-fit model) from its exact value (used to generate mock RM) as a function of different configurations. See the text for details on the x-axis description. The red solid line with the circle markers shows the cases of aligned transiting planets (λ = 0 deg), the blue dashed line with square markers shows the cases of transiting planets with λ = 30 deg, and the green dotted line with triangle markers shows the cases of transiting planets with λ = 60 deg. Bottom left: same as the top panel, but for vsini. Top and bottom right: same as the top left and bottom left panels, but for the RM anomalies due to occultation with the stellar plages.
Current usage metrics show cumulative count of Article Views (full-text article views including HTML views, PDF and ePub downloads, according to the available data) and Abstracts Views on Vision4Press platform.
Data correspond to usage on the plateform after 2015. The current usage metrics is available 48-96 hours after online publication and is updated daily on week days.
Initial download of the metrics may take a while.