Fig. 2
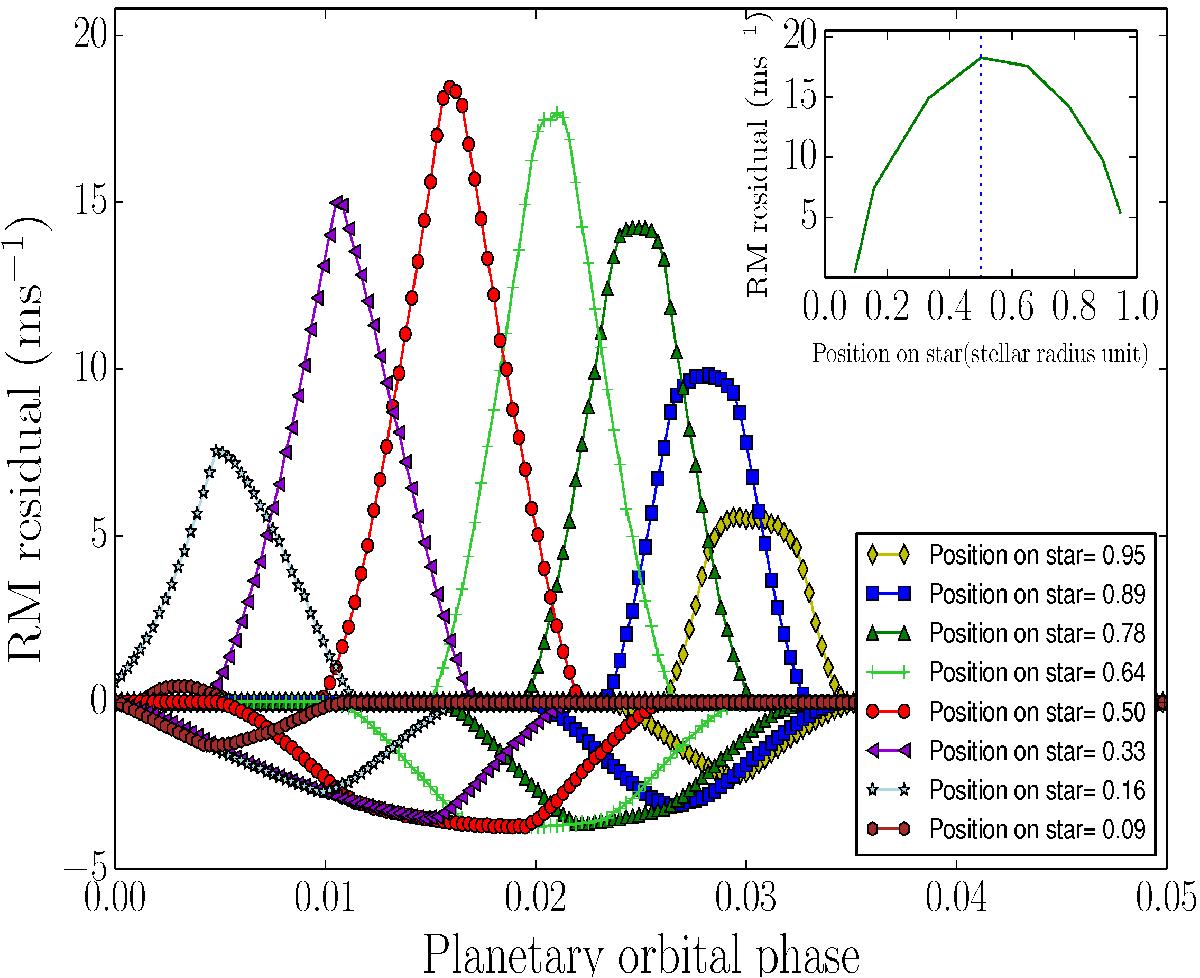
Amplitude of RM anomalies as a function of the time that anomaly appears in the RM signal. RM anomalies for the case of occultation with stellar spot are shown in the positive part of y-axis and the occultation with the stellar plage are presented in the negative part of y-axis. Panel on the top-right corner shows the same but as a function of the position of planet-active region occultation (0 on the x-axis means overlap occurs while the active region is at the center of stellar disk, and 1 means occurs on the limb of the stellar disk).
Current usage metrics show cumulative count of Article Views (full-text article views including HTML views, PDF and ePub downloads, according to the available data) and Abstracts Views on Vision4Press platform.
Data correspond to usage on the plateform after 2015. The current usage metrics is available 48-96 hours after online publication and is updated daily on week days.
Initial download of the metrics may take a while.