Fig. 1
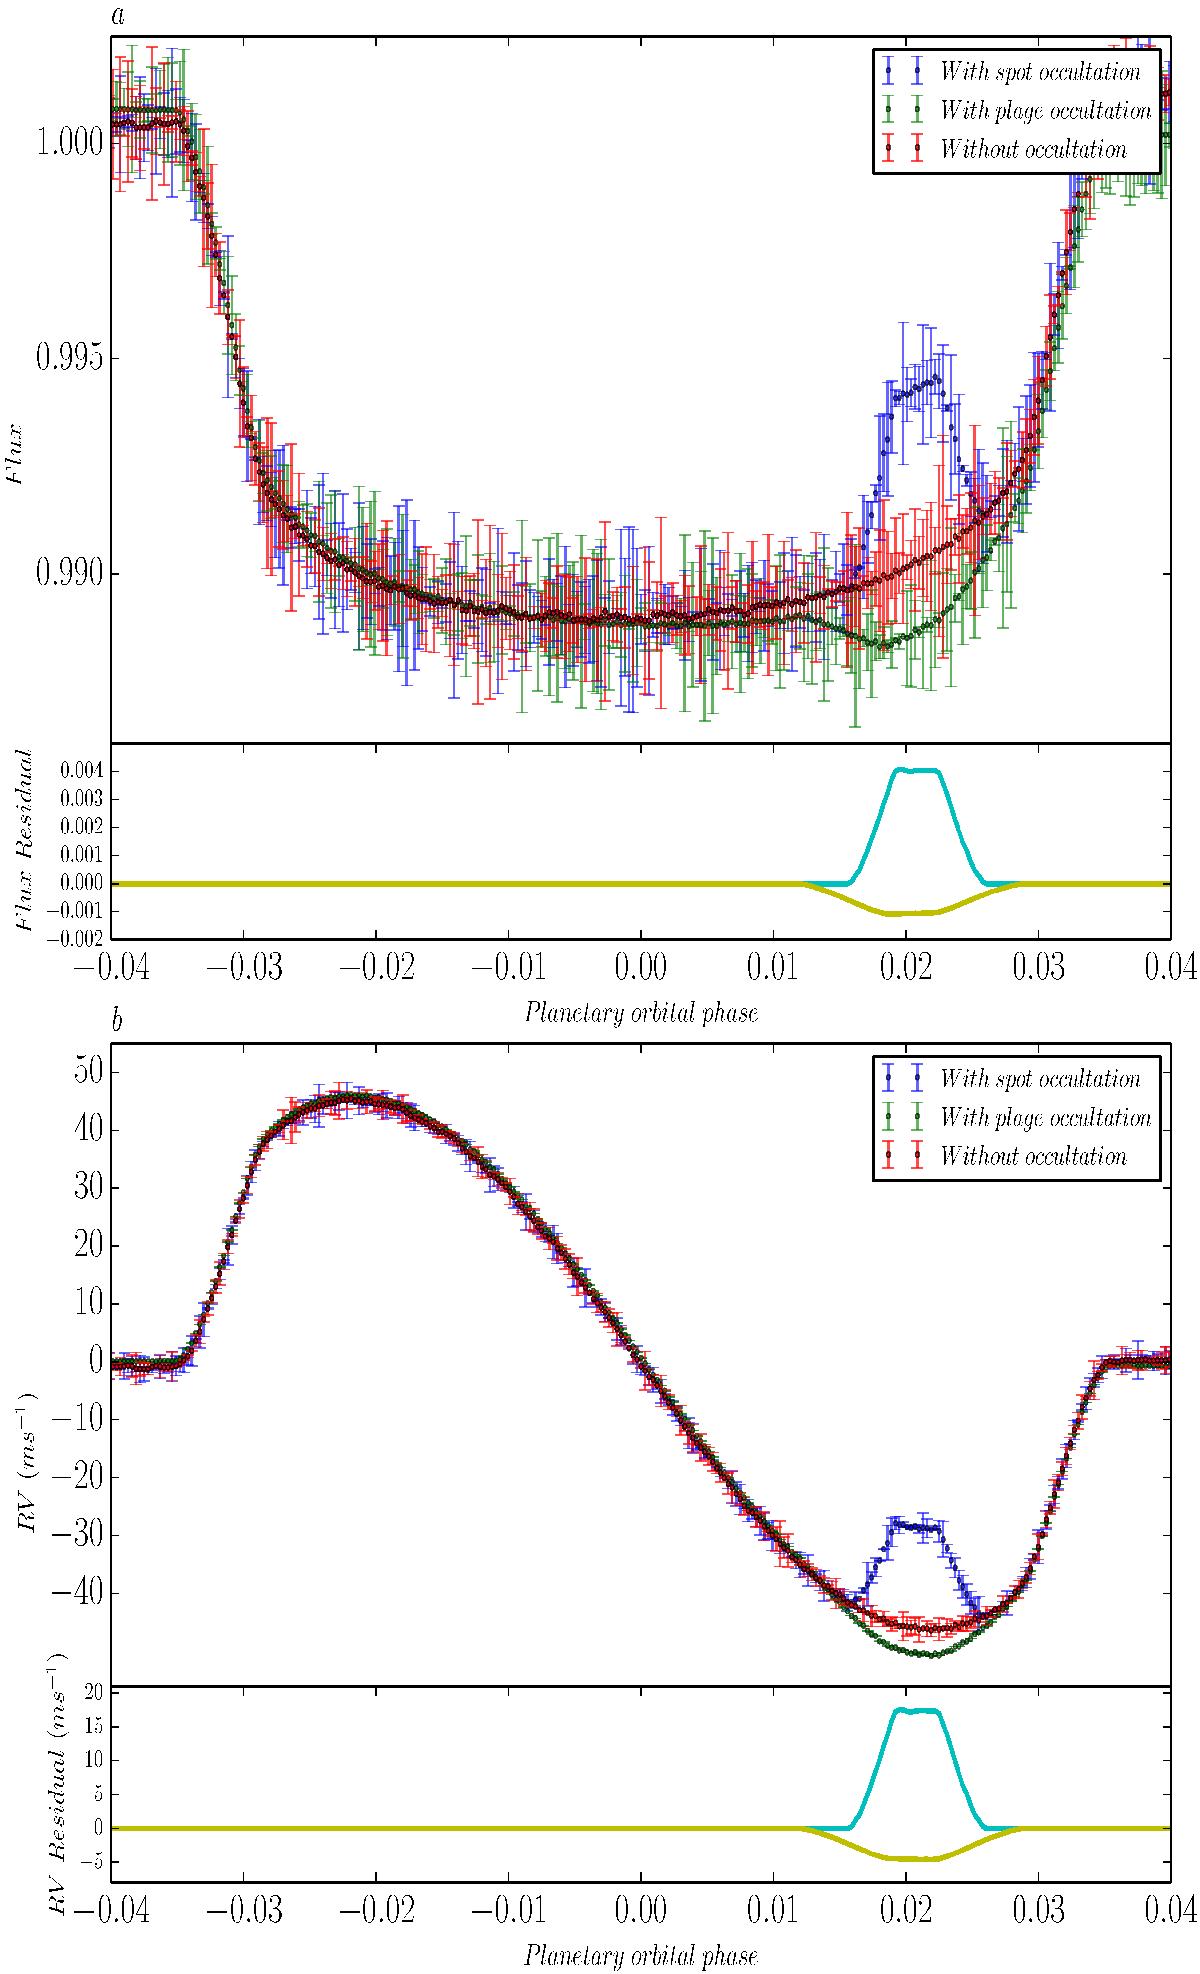
Top: simulated transit light curve anomaly due to occultation of a transiting planet with a spot or a plage shown by the blue and green dots, respectively. The red dots show the simulated transit light curve without occultation with any active regions. The simulation was done for an aligned Jupiter-size transiting planet overlapping a dark spot with filling factor of 0.5% and plage with filling factor of 2.25%. The error bar obtained by adding random Gaussian noise at the level of 300 ppm (which is consistent with the photometric precision achievable by Kepler for an 11 mag star on short cadence). Bottom: same as the top panel for the simulated RM observations. The error bar obtained by adding random Gaussian noise at the level of 1 ms-1 (which is consistent with the RV precision achievable by current spectrographs such as HARPS and HARPS-N).
Current usage metrics show cumulative count of Article Views (full-text article views including HTML views, PDF and ePub downloads, according to the available data) and Abstracts Views on Vision4Press platform.
Data correspond to usage on the plateform after 2015. The current usage metrics is available 48-96 hours after online publication and is updated daily on week days.
Initial download of the metrics may take a while.