Fig. B.3
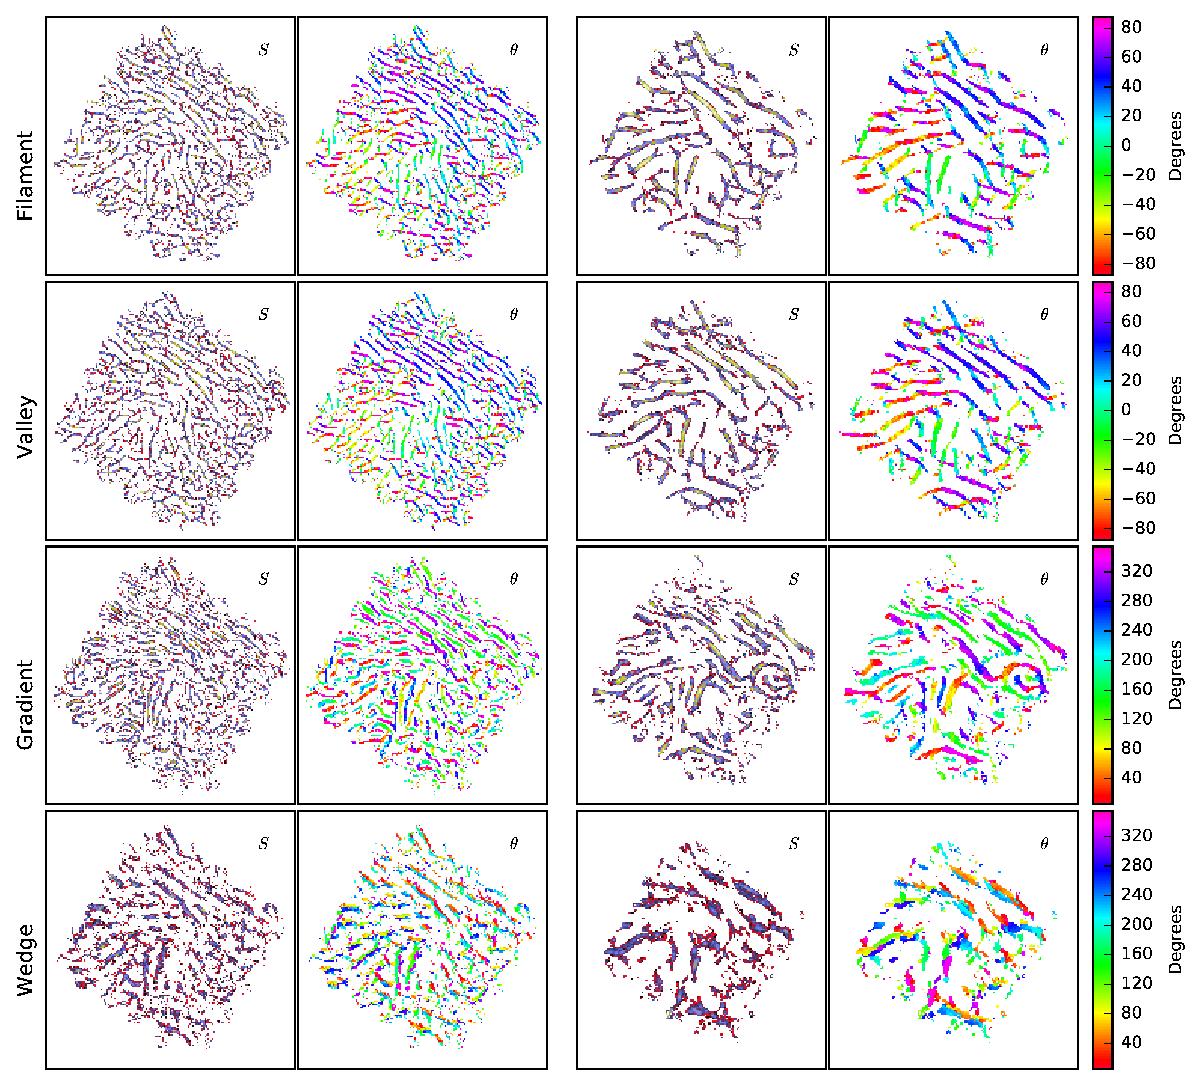
Results of TM using four different templates. The analysed data are the 250 μm surface brightness map of LDN 1642 in Fig. B.2. The four templates (named on the left side of the figure) are depicted in Fig. B.1. Each pair of frames shows the S and θ maps of one extraction. On each row, the first two frames correspond to F1 = 1′ and the last two frames to F1 = 2′. The colour scale of S maps is the same as for the position angles, with a different but a fixed numerical scale. Pixels with S below the 80% percentile value have been masked.
Current usage metrics show cumulative count of Article Views (full-text article views including HTML views, PDF and ePub downloads, according to the available data) and Abstracts Views on Vision4Press platform.
Data correspond to usage on the plateform after 2015. The current usage metrics is available 48-96 hours after online publication and is updated daily on week days.
Initial download of the metrics may take a while.