Fig. 2
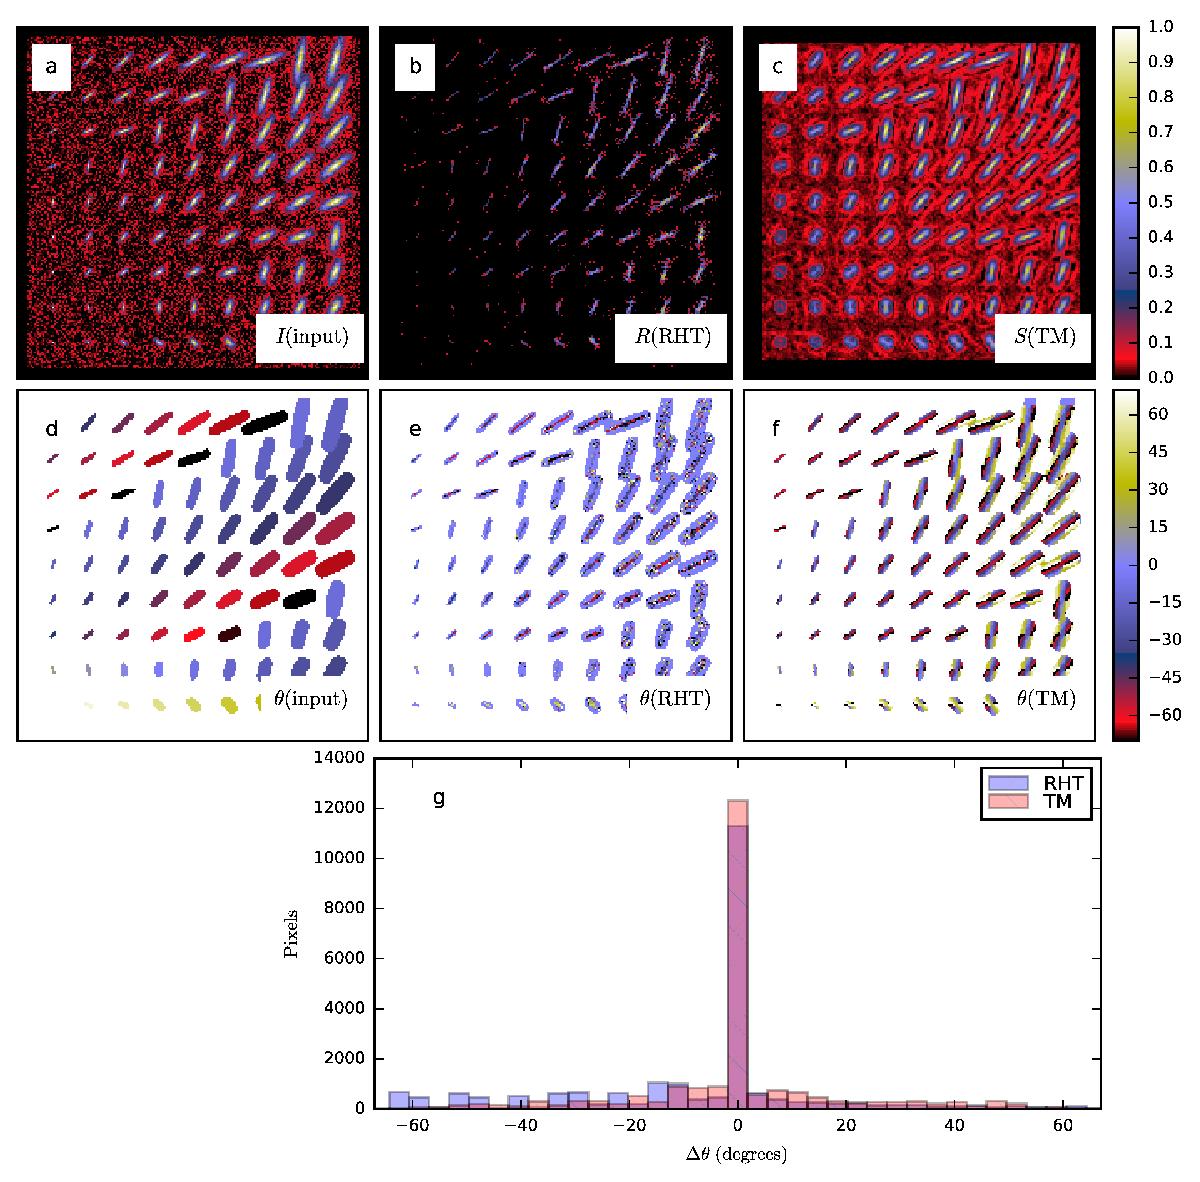
Comparison of RHT and TM in case of short elongated structures. Frame a shows the input image and frame d the position angles (in degrees) of the clump main axes. The width parameter R2 increases from one to five across the columns of clumps. The ratio of R1/R2 (elongation) is varied between the values of two and five, the uppermost row of clumps having the largest elongation. The second and third column correspond to RHT and TM results, respectively. The RHT map of R is shown in frame b and the TM map of S in frame c. The recovered position angles are shown in frames e and f, for RHT and TM, respectively. In the second row maps pixels with the signal below the 1σ noise level have been masked. The frame g shows histograms of position angle errors, in correspondence to the data in frames e and f.
Current usage metrics show cumulative count of Article Views (full-text article views including HTML views, PDF and ePub downloads, according to the available data) and Abstracts Views on Vision4Press platform.
Data correspond to usage on the plateform after 2015. The current usage metrics is available 48-96 hours after online publication and is updated daily on week days.
Initial download of the metrics may take a while.