Fig. 1
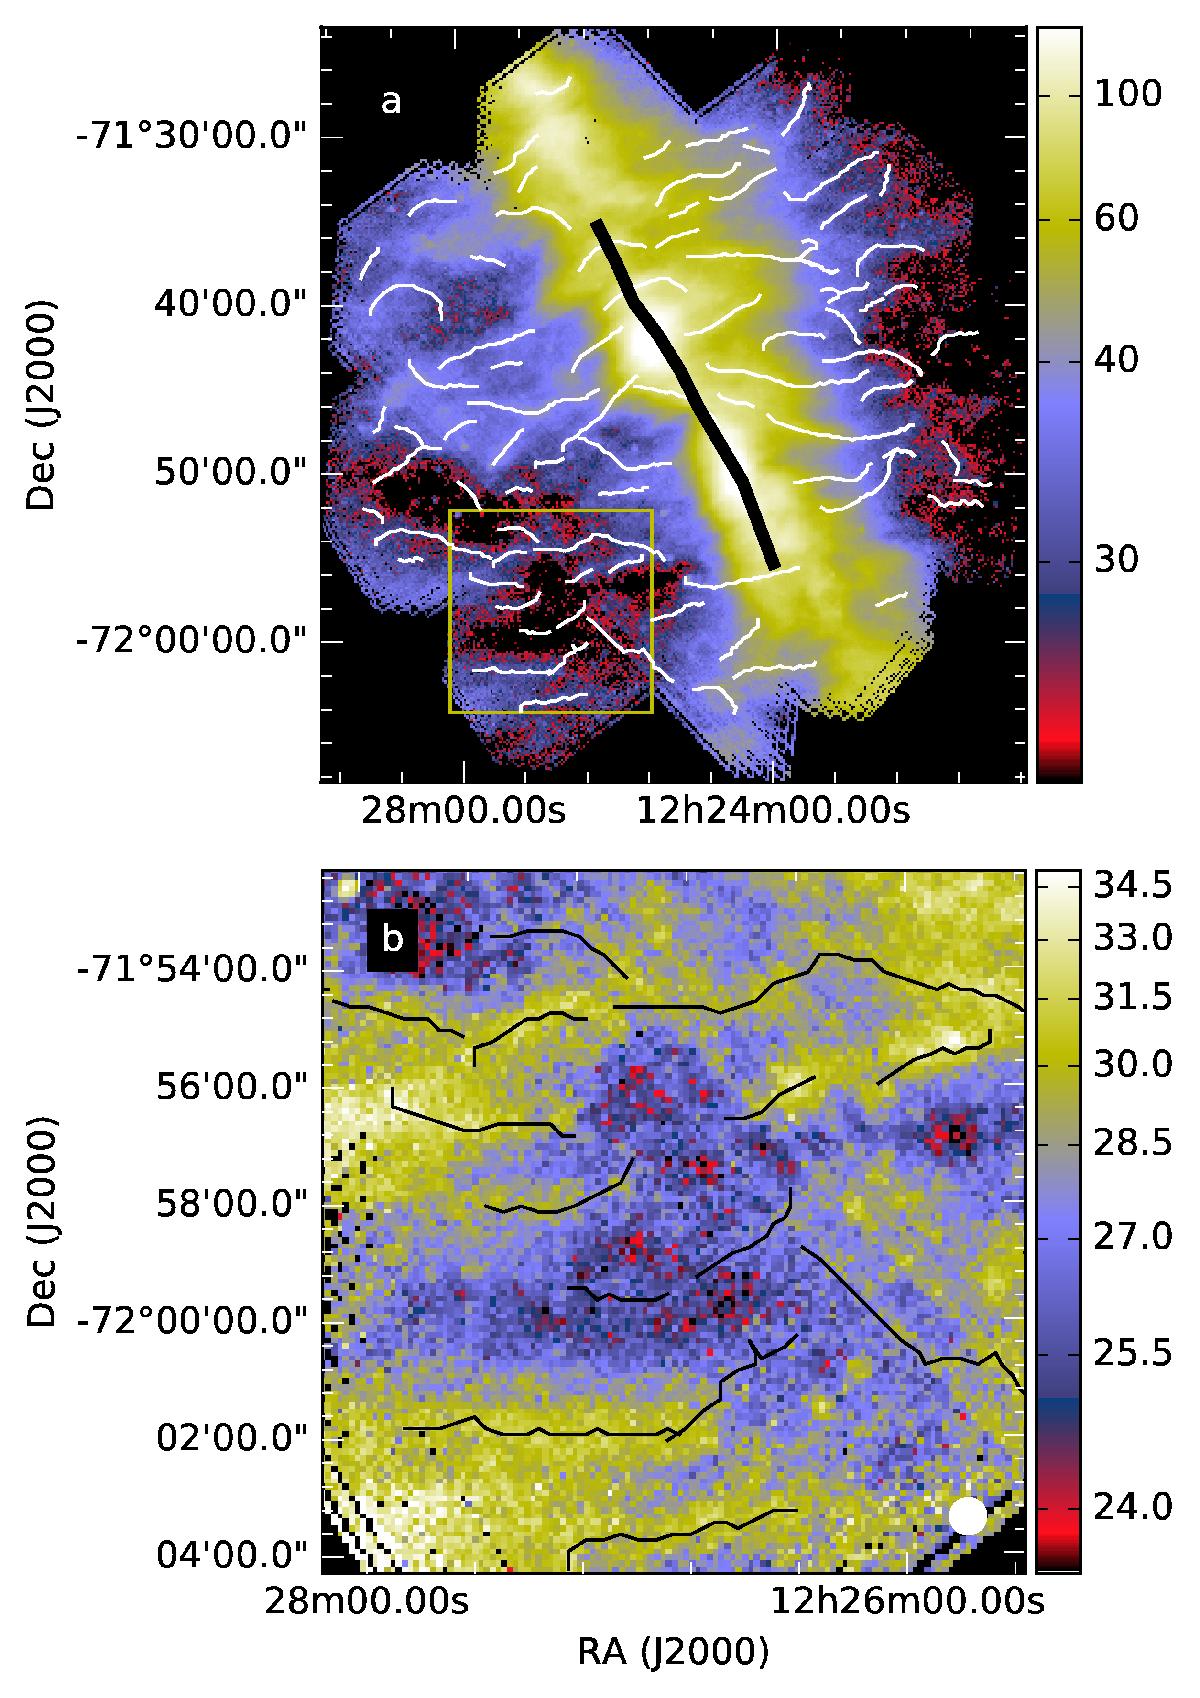
Filament skeletons based on TM results. The skeletons correspond to a scale of F1 = 0.6′ and the TMN method except for the thick black line that shows the only skeleton found at the scale of F1 = 5.0′ and without data normalisation. The background is the Herschel 250 μm surface brightness image in units of MJy sr-1. The lower frame shows details of a smaller region (marked with a box in the upper frame) where the F1 = 0.6′ skeletons are drawn in black for better contrast.
Current usage metrics show cumulative count of Article Views (full-text article views including HTML views, PDF and ePub downloads, according to the available data) and Abstracts Views on Vision4Press platform.
Data correspond to usage on the plateform after 2015. The current usage metrics is available 48-96 hours after online publication and is updated daily on week days.
Initial download of the metrics may take a while.