Fig. 2
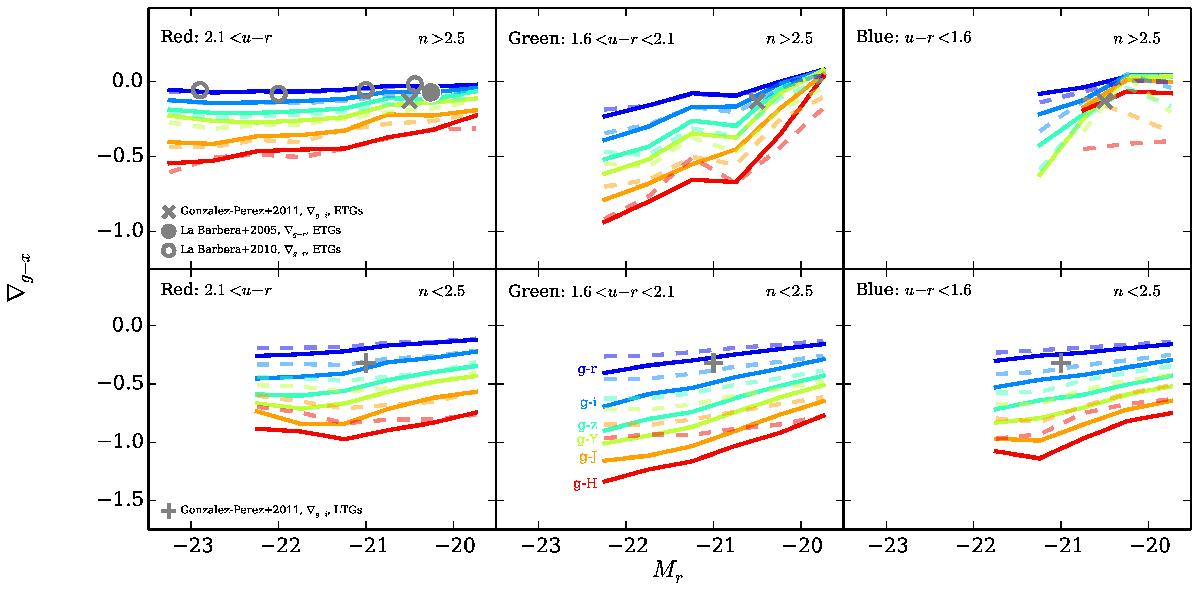
Median colour gradient, ∇g−x, where x = rizYJH, as a function of r-band absolute magnitude, Mr, in each of our colour/Sérsic index subsamples. Solid and dashed lines show colour gradients over the radius ranges 0.1Re–1Re, and 0.1Re–2Re, respectively. Lines are limited to magnitude bins containing at least 10 objects. They are therefore only shown where each subsample makes up a significant fraction (≳1%) of the galaxy population. Different colours correspond to different wavebands, with g−r at the top to g−H at the bottom, as indicated. Results of previous studies are overlaid in the panels which most closely match the subsample of that study (see legends). We see that only the red, high-n population has galaxies brighter than Mr ~ −22.5, so these galaxies dominate at the bright end.
Current usage metrics show cumulative count of Article Views (full-text article views including HTML views, PDF and ePub downloads, according to the available data) and Abstracts Views on Vision4Press platform.
Data correspond to usage on the plateform after 2015. The current usage metrics is available 48-96 hours after online publication and is updated daily on week days.
Initial download of the metrics may take a while.