Fig. 1
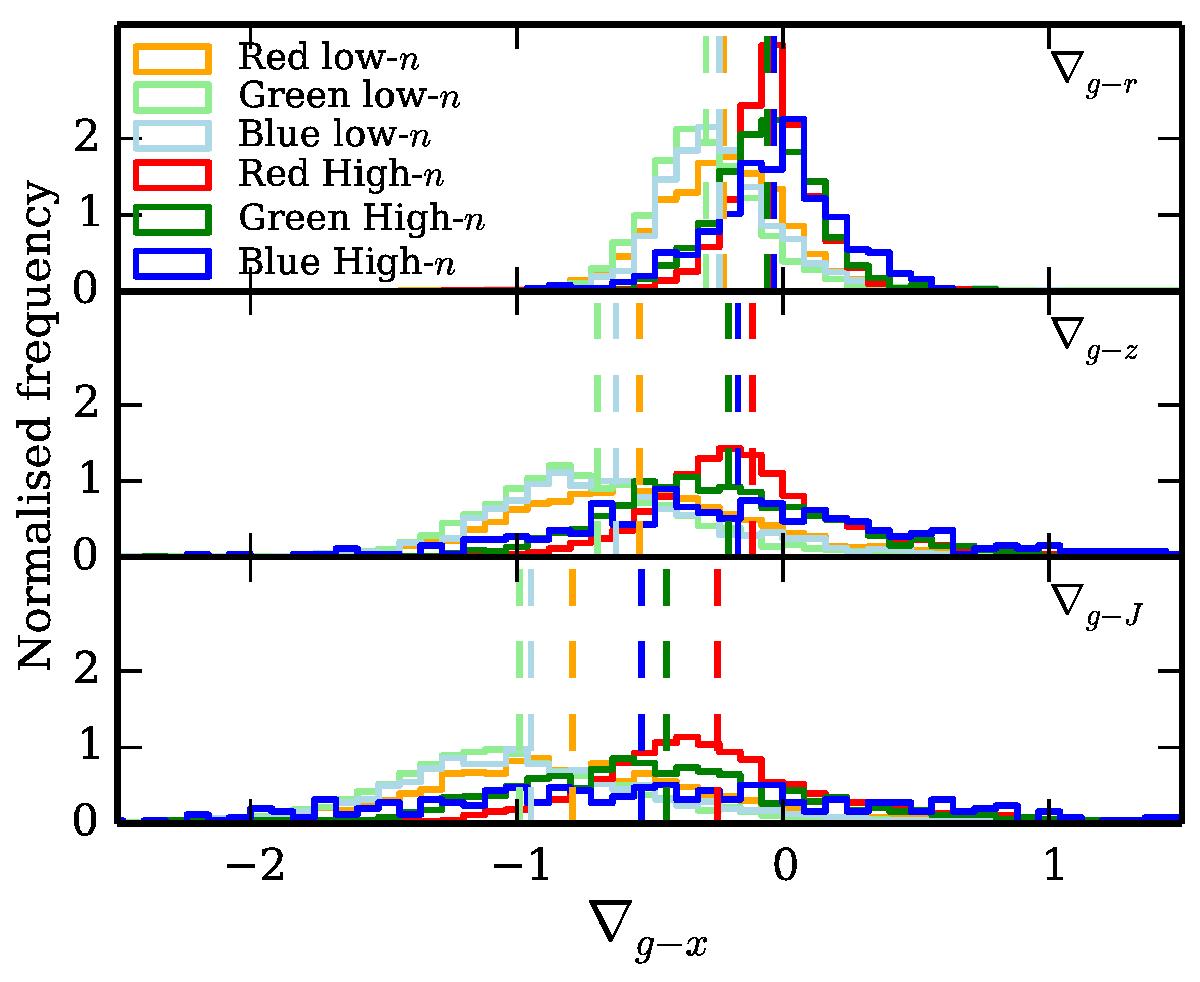
Distributions of ∇g−x for galaxies in each of our colour/Sérsic index subsamples (see Sect. 2 for more details), normalised to unit integral. Each panel shows the distribution for a different pair of bands. The median of each distribution is indicated by a vertical dashed line. These median values, and their uncertainties, can be found in Table 1. A bimodality in colour gradients for high- and low-n galaxies can be seen in all wavebands.
Current usage metrics show cumulative count of Article Views (full-text article views including HTML views, PDF and ePub downloads, according to the available data) and Abstracts Views on Vision4Press platform.
Data correspond to usage on the plateform after 2015. The current usage metrics is available 48-96 hours after online publication and is updated daily on week days.
Initial download of the metrics may take a while.