| Issue |
A&A
Volume 593, September 2016
|
|
|---|---|---|
| Article Number | A95 | |
| Number of page(s) | 9 | |
| Section | Galactic structure, stellar clusters and populations | |
| DOI | https://doi.org/10.1051/0004-6361/201628710 | |
| Published online | 29 September 2016 | |
New detections of embedded clusters in the Galactic halo
Universidade Federal do Rio Grande do Sul, Departamento de Astronomia, CP 15051, RS, 91501-970 Porto Alegre, Brazil
e-mail: denilso.camargo@ufrgs.br; bica@ufrgs.br; charles@ufrgs.br; denilso.camargo@ufrgs.br
Received: 14 April 2016
Accepted: 17 June 2016
Context. Until recently it was thought that high Galactic latitude clouds were a non-star-forming ensemble. However, in a previous study we reported the discovery of two embedded clusters (ECs) far away from the Galactic plane (~ 5 kpc). In our recent star cluster catalogue we provided additional high and intermediate latitude cluster candidates.
Aims. This work aims to clarify whether our previous detection of star clusters far away from the disc represents just an episodic event or whether star cluster formation is currently a systematic phenomenon in the Galactic halo. We analyse the nature of four clusters found in our recent catalogue and report the discovery of three new ECs each with an unusually high latitude and distance from the Galactic disc midplane.
Methods. The analysis is based on 2MASS and WISE colour-magnitude diagrams (CMDs), and stellar radial density profiles (RDPs). The CMDs are built by applying a field-star decontamination procedure, which uncovers the cluster’s intrinsic CMD morphology.
Results. All of these clusters are younger than 5 Myr. The high-latitude ECs C 932, C 934, and C 939 appear to be related to a cloud complex about 5 kpc below the Galactic disc, under the Local arm. The other clusters are above the disc, C 1074 and C 1100 with a vertical distance of ~3 kpc, C 1099 with ~ 2 kpc, and C 1101 with ~1.8 kpc.
Conclusions. According to the derived parameters ECs located below and above the disc occur, which gives evidence of widespread star cluster formation throughout the Galactic halo. This study therefore represents a paradigm shift, by demonstrating that a sterile halo must now be understood as a host for ongoing star formation. The origin and fate of these ECs remain open. There are two possibilities for their origin, Galactic fountains or infall. The discovery of ECs far from the disc suggests that the Galactic halo is more actively forming stars than previously thought. Furthermore, since most ECs do not survive the infant mortality, stars may be raining from the halo into the disc, and/or the halo may be harbouring generations of stars formed in clusters like those detected in our survey.
Key words: ISM: clouds / Galaxy: halo / open clusters and associations: general
© ESO, 2016
1. Introduction
Embedded clusters (ECs) are the first evolutionary stage of open clusters and provide a means to explore the stellar content in gas and dust enshrouded complexes (e.g. Tutukov 1978; Lada & Lada 2003; Camargo et al. 2011, 2012). In particular distances and ages can be constrained more accurately.
In the Galaxy, most young open clusters and embedded clusters are essentially located within the thin disc less than ~ 250 pc from the Galactic plane (e.g. Camargo et al. 2013, 2015c). However, we discovered recently two ECs (Camargo 438 and Camargo 439) within a high-latitude cloud (Camargo et al. 2015a, hereafter Paper I) using WISE (Wright et al. 2010). These clusters appear to be related to the high latitude cloud HRK 81.4-77.8 (Heiles et al. 1988). Subsequently, in an extended version of our cluster catalogue (Camargo et al. 2016), we found other ECs projected close to or on high and intermediate Galactic latitude clouds. Such results suggested ongoing star formation in the Galactic halo.
The Galactic halo is populated by HI clouds known as intermediate and high-latitude clouds (HLCs), which are traced by the 21 cm hyperfine transition line (Blitz et al. 1984; Dickey & Lockman 1990; Magnani et al. 1996). HLCs, as a rule, present kinematics inconsistent with Galactic rotation, and are designated as high velocity (HVCs) and intermediate velocity clouds (IVCs), in contrast to low velocity ones (LVCs) that populate the Galactic disc (Muller et al. 1963; Kuntz & Danly 1996; Martin et al. 2015). HLCs appear to be common in disc galaxies such as the Milky Way, and some of them show signs of recent or ongoing mergers (Fraternali et al. 2001; Thilker et al. 2004; Battaglia et al. 2006; Heald et al. 2007; Oosterloo et al. 2007; Sancisi et al. 2008; Cresci et al. 2010). Regarding their origin, there is no consensus and both Galactic and extragalactic sources have been proposed.
HLCs may be produced by an internal engine based on the stellar feedback. In this process winds from OB stars and supernovae blow away gas and dust from the disc in a chimney-like scenario. This gas and dust subsequently fall back onto the disc as Galactic fountains (Shapiro & Field 1976; Bregman 1980). During this phase they can merge to form molecular clouds. Chimneys, powered by multiple supernovae within OB associations may blow superbubbles, which can throw gas and dust away on kiloparsec scales (Quilis & Moore 2001; Pidopryhora et al. 2007). In this sense, Melioli et al. (2008) point out that typical Galactic OB associations with 100 SNe may eject gas and dust up to ~ 2 kpc (Quilis & Moore 2001; Pidopryhora et al. 2007); however, Melioli et al. (2009) argue that even multiple OB associations cannot throw dust beyond 3.5 kpc.
There are two possible explanations for an extragalactic origin: (i) primordial cold dark-matter encapsulated clouds accreted directly from the intergalactic medium or (ii) infall of dark-matter free clouds remaining from the tidal disruption of dwarf galaxies and galaxy collisions (Oort 1966; Blitz et al. 1999; Putman et al. 2004; Kerés et al. 2005; Kaufmann et al. 2006, 2010; Oosterloo et al. 2007; Sancisi et al. 2008; Hammer et al. 2015; Wolfe et al. 2015; Tepper-Garcia et al. 2015). Gas accretion is needed to provide the low-metallicity material required by chemical evolution models (Chiappini et al. 2001), since in a Galactic fountain it appears that the gas falls back onto the Galactic disc close to its original locus (Melioli et al. 2008, 2009) and does not affect the metal abundance (Spitoni et al. 2009). Furthermore, on large timescales, the Galaxy is apparently forming stars at a constant rate (Binney et al. 2000; Fraternali 2014), which implies that its gaseous content is being continuously replenished by the infall of low metallicity gas (Fraternali & Tomassetti 2012; Joung et al. 2012).
There is evidence that IVCs (| vLSR |=50−100 km s-1) arise from Galactic fountains, while HVCs (| vLSR |>100 km s-1) appear to be related to infalling gas (Putman et al. 2012). However, if not disrupted on their infall, massive dark-matter free HVCs may be decelerated to LVCs mainly by ram-pressure stripping, Rayleigh-Taylor and Kelvin-Helmholtz instabilities, and dragging forces, leading to substructured clouds (Benjamin & Danly 1997; Maller & Bullock 2004; Heitsch & Putman 2009; Plöckinger & Hensler 2012; Hernandez et al. 2013).
Given the implications of our recent results, a new study was necessary to verify whether star formation in the Galactic halo is systematic or an episodic event. Thus, in this work we derive parameters and discuss the properties of seven high and intermediate Galactic latitude ECs.
This paper is organized as follows. In Sect. 2 we present the cluster sample and derive the fundamental parameters. In Sect. 3 we discuss the results, and in Sect. 4 we provide the concluding remarks.
2. Cluster analysis
We searched for clusters by looking for stellar density enhancements in the WISE Atlas, initially in large areas (2° × 2°), in order to identify possible candidates. Subsequently, we inspected these candidates in more detail using the WISE individual bands. Heavily dust-obscured ECs are more easily detected in the W3 (12 μm) and W4 (22 μm) WISE bands, which are more sensitive to dust emission. W1 (3.4 μm) and W2 (4.6 μm) are more suited to identifying stellar content. The multicolour (false colours) images are a composition of the four bands. Given the rarity of the new findings, the search required a lot of time and dedication. The initial inspection and selection of a sample of cluster candidates were made by one of us (Denilso Camargo) and subsequently checked independently by the other authors.
Positions of the present star clusters or candidates.
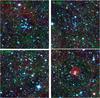 |
Fig. 1 WISE (15′ × 15′) multicolour images centred on the central coordinates of the embedded clusters C 1074, C 939, C 1099, and C 934. North is to the top and east to the left. Circles encompass more probable cluster stars (Sect. 2). |
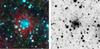 |
Fig. 2 WISE multicolour and W1 images (7′ × 7′) centred on C 1100. C 1100 shows a dust emission shell. North is to the top and east to the left. |
Fundamental parameters and Galactocentric components for the ECs in this work.
The sample of star clusters projected towards the halo is listed in Table 1, together with their equatorial and Galactic coordinates. Three of them are ECs discovered in the present study by means of visual inspection on WISE images and four were previously reported in Camargo et al. (2016). Following our recent star cluster catalogue designations (Camargo et al. 2015b,c, 2016) we adopt the names C 1099, C 1100 and C 1101 for the newly discovered ECs. Figure 1 shows multicolour images of four sample clusters. They are considerably populated, concentrated, and contrasted. Figure 2 shows images of C 1100 in multicolour and W1, while Fig. 3 gives a multicolour image for C 932. C 1100 is surrounded by dust emissions, while C 932 is deeply embedded. Figure 4 presents a WISE multicolour image of C 1101. Colour–magnitude diagrams (CMDs) and stellar radial density profiles (RDPs) are shown in Figs. 5 to 8, while Figs. 9 and 10 give the positions of three clusters (C 932, C 934, and C 939) that are projected on a halo cloud as seen in IRAS 100 μm and WISE multicolour, respectively. As far as we are aware the halo cloud containing the 3 new clusters has not been reported before. We will refer to it as CBB 188.13-70.84, following Heiles et al. (1988) for the cloud HRK 81.44-77.8, which was the first halo cloud with detected star formation (Paper I). The stellar density contrast between clusters and field is evident in Fig. 10. Note that the diffuse dust emission of the cloud CBB 188.13-70.84 is stronger to the NE corner of Fig. 10, in agreement with Fig. 9. Finally, Fig. 11 shows the spatial distribution of the clusters in this study.
To disentangle the cluster intrinsic evolutionary sequences in the CMD from those of the stellar background, we built the CMDs by applying a field star decontamination procedure to the raw photometry extracted from a circular area centred on each cluster (Bonatto & Bica 2007, 2008b, 2010; Bica et al. 2008a). Cluster fundamental parameters are derived with PARSEC isochrones (Bressan et al. 2012) fitted to the cluster sequences in the decontaminated CMDs (Camargo et al. 2013). The clusters present a standard MS and PMS distribution in the CMDs (e.g. Bonatto & Bica 2009).
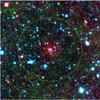 |
Fig. 3 WISE multicolour image (15′ × 15′) centred on C 932. C 932 is deeply embedded. North is to the top and east to the left. |
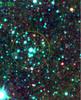 |
Fig. 4 WISE (15′ × 15′) multicolour images centred on the central coordinates of the embedded cluster C 1101. North is to the top and east to the left. |
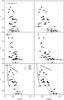 |
Fig. 5 C 1074: example of decontamination procedure. Top panels: 2MASS observed CMDs. Middle panels: equal area comparison field. Bottom panels: field-star decontaminated CMDs fitted with PARSEC isochrones for MS and PMS stars. We also show the reddening vector for Av = 1 to 5. |
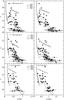 |
Fig. 6 Decontaminated CMDs fitted by PARSEC isochrones, for the newly found embedded cluster C 1099 (top panels), C 1100 (middle panels), and C 1101 (bottom panels). We also show the reddening vector for AV = 1 to 5. |
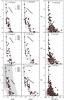 |
Fig. 7 Decontaminated CMDs for the high-latitude embedded cluster C 932 (top panels), C 934 (middle panels), and C 939 (bottom panels). The colour–magnitude filter used to isolate cluster stars is shown as a shaded region in the decontaminated CMD of C 939. We also show the reddening vector for AV = 1 to 5. |
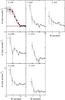 |
Fig. 8 Radial density profile for the embedded clusters in this study. The brown horizontal shaded region in the RDP of C 939 corresponds to the stellar background level measured in the comparison field and the grey region corresponds to the 1σ King fit uncertainty. |
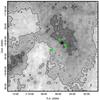 |
Fig. 9 IRAS 100 μm image of the cloud complex possibly related to the high-latitude ECs C 932, C 934, and C 939, which are identified by green circles. |
Figure 5 gives the 2MASS J × (J−H) and J × (J−Ks) CMDs for C 1074. We illustrate the background stellar density subtraction. The top panels show the raw photometry extracted from the cluster central region (R = 5 arcmin). The middle panels show the equal area comparison fields. In the bottom panels we show the decontaminated CMDs and fit them with MS and PMS isochrones. The best fitting isochrones provide an age of 3 ± 1 Myr for a distance from the Sun of ~ 4.1 kpc and distance from the Galactic disc mid-plane of ~ 3 kpc. Figure 6 shows the 2MASS CMDs for the newly found ECs C 1099, C 1100, and C 1101. For brevity we show only the J × (J−H) and J × (J−Ks) field-star decontaminated CMDs. Table 2 gives ages, distance from the Sun, and vertical distance from the midplane.
We adopt WISE photometry to build radial density profiles (RDPs), since the WISE bands are more sensitive to PMS stars. The RDPs of the present objects (Fig. 8) are typical of clusters in the embedded phase and do not follow a King’s law (Bonatto & Bica 2011; Camargo et al. 2010, 2011, 2012), except C 939. For this object we built the RDP with stars selected by a colour–magnitude filter (Fig. 7) used to discard stars with colours compatible with those of the field stars (Bonatto & Bica 2008a; Camargo et al. 2009). We tentatively built colour magnitude filters for all objects in this study, but the filtered photometry did not produce significant gains with respect to the raw photometry. Since stars of different masses in the decontaminated CMDs of ECs in this work can be very reddened, such filters are not able to discard a significant amount of field stars without affecting the cluster PMS sequence. We fitted the RDP of C 939 with a King’s function σ(R) = σbg + σ0/ (1 + (R/Rcore)2 (King 1962), where σbg is the residual background surface density of stars, σ0 is the central density of stars, and Rcore is the core radius. The cluster radius (RRDP) and uncertainty can be estimated by considering the fluctuations of the RDPs with respect to the residual background. RRDP corresponds to the distance from the cluster centre where the RDP and the comparison field stellar density become statistically indistinguishable. σbg is measured in the comparison field and kept fixed. The RDP of C 939 gives a cluster radius of 13.6 ± 2 pc and a central density of σ0 = 4.1 ± 1.2 ∗ pc-2. It is probable that C 939 simply mimics a King’s profile, owing to its young age. Table 3 provides structural parameters derived for the particular case of C 939. The remaining clusters have profiles that indicate the presence of a cluster, but ECs in the early evolutionary phase as a rule lack the span of time to be an isothermal sphere and thus cannot be fitted by a King-like profile (Camargo et al. 2012, 2015c; Bica et al. 2008b). Such profiles fit clusters in near dynamical equilibrium. On the other hand, some ECs appear to be evolved enough to follow or simply to mimic a King law (Camargo et al. 2010, 2011).
Structural parameters for the high latitude embedded cluster C 939.
3. Discussion
The discovery of high latitude ECs is fundamental to our understanding of the Galaxy’s formation, evolution, and dynamics, since the new findings affect the role of the halo in the Galactic evolutionary process. It seems more active than previously thought. If these clusters behave like those formed in the Galactic disc (see infant mortality – Tutukov 1978; Lada & Lada 2003), most of them will not reach the disc as bound systems. Thus, it may be that young stars are raining from the halo into the disc. Alternatively, generations of stars, as formed in the present clusters, may be populating the halo.
Galactic fountains or infall are the possible origins for the ECs in this sample. Both scenarios present possible explanations and restrictions. The accretion of low metallicity gas from the intergalactic medium may occur through filamentary structures with the gas cooling into clouds (Fernández et al. 2012). Subsequently HVCs may be destroyed or fragmented into smaller clouds by drag forces from the halo and phenomena such as Rayleigh-Taylor and Kelvin-Helmholtz instabilities. Star formation can be triggered by these interactions, within clouds that reach sufficient density (Figs. 9 and 10). However, there is evidence that star formation is possible only within dark-matter encapsulated HVCs such as the Smith Cloud (Smith 1963; Heitsch & Putman 2009; Nichols & Bland-Hawthorn 2009; Joung et al. 2012). Christodoulou et al. (1997) argue that without dark matter, HVCs are unable to reach the mass required to collapse. On the other hand, C 932, C 934, and C 939 are located right above the Local spiral arm (Fig. 11), which would be consistent with the chimney scenario. Schlafly et al. (2015) mapped various bubble-like structures vertically along the range 0.3 to 2.8 kpc, which form the Orion superbubble. The expansion of these substructures powered by massive stellar winds and supernovae triggers star formation in various shells and rings, inputting energy to the superbubble (Lee & Chen 2009). The star formation engine in the Galactic fountain may work in a similar way to the infall scenario, through the interaction of a cloud with the surrounding halo environment. However, high-latitude clusters in this study are located at distances from the disc larger than has been expected for a chimney-like event in recent studies (Melioli et al. 2009). Regardless of the scenario, a possible cloud-cloud interaction may be leading the clouds analysed in Fig. 9 to collapse and triggering not only star formation, but also cluster formation. However, the timescale for cloud-cloud collision in a cloud complex appears to be larger than 1 Gyr (Christodoulou et al. 1997). Therefore, additional studies are required to check the presence of dark-matter in HVCs, estimate the cloud-cloud interaction timescales, and provide more insight into the effect of the halo environment on the HVCs and chimney-like events. That is beyond the purpose of this study.
In Paper I we calculated orbits for the two ECs therein studied using UCAC4 proper motions and a Galactic potential. We could not decide between a Galactic or extragalactic origin for the cloud, given the uncertainties. With the advent of Gaia (Perryman et al. 2001), which will provide very accurate positions and velocities for stars in the Galactic halo, we intend to explore in more detail orbits for the ECs from this study and Paper I. The halo has in recent years been the site of discoveries of low luminosity dwarf galaxies, tidal streams, and faint globular clusters (e.g. Antoja et al. 2015; Bechtol et al. 2015; Drlica-Wagner et al. 2015; Huxor & Grebel 2015; Koposov et al. 2015; Luque et al. 2016). Now, the present study and Paper I indicate that yet another process occurs in the halo: recent star formation.
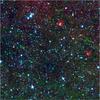 |
Fig. 10 WISE multicolour image (45′ × 45′) with a zoom in on the cloud complex of Fig. 9 to show the ECs C 932, C 934, and C 939 in more detail. |
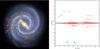 |
Fig. 11 Spatial distribution of the ECs in this study and Paper I (green circles) compared to ECs in our previous works (red circles). Credit: Robert Hurt (NASA/JPL) and Camargo et al. (2015c). |
In Camargo et al. (2015a), we discovered star cluster formation in the Galactic halo. Despite the importance of that discovery, there remained some questions, for instance, is star cluster formation far away from the disc just an episodic event or is the halo the site of systematic EC formation? Subsequently, in Camargo et al. (2016) we found four additional high latitude ECs, and here we analyse them together with three others found in this study. Thus, this work points to a new paradigm in star and star cluster formation, in the sense that the formation of such objects occurs in the halo and it seems to be systematic.
The embedded cluster C 1100 shows a dust emission bubble structure (Fig. 2). Such objects with a bubble are relatively common in our recent catalogue (Camargo et al. 2016), especially for ECs and embedded stellar groups with ongoing star formation. The EC catalogue by Majaess (2013) also shows this.
4. Concluding remarks
In Paper I we reported two ECs (C 438 and C 439) within a high-latitude cloud, which were the first high-latitude embedded clusters discovered. In this study we find new results about star cluster formation in high-latitude clouds and further infer that the Galactic halo is currently forming stars within ECs.
Using 2MASS and WISE photometry we analysed the nature of seven ECs at high and intermediate Galactic latitudes, three of them first reported in this work (C 1099, C 1100, and C 1101). The age of these clusters are in the range of 1 to 5 Myr. C 932, C 934, and C 939 are high-latitude ECs projected within the newly identified cloud complex including CBB 188.13-70.84. These clusters are located at a vertical distance of about 5 kpc below the Galactic disc. C 1074, C 1099, C 1100, and C 1101 are in the range 1.7 to 3.2 kpc above the disc. The clusters show decontaminated CMDs with the typical pattern of MS and PMS stars in embedded clusters (Paper I and references therein). Their spatial distribution is given in Fig. 11. We have gathered a significant collection of very young star clusters in the halo.
Paper I and the present additional study point to a paradigm shift in the halo, which becomes an ongoing site of star formation in the Galaxy.
Acknowledgments
We thank an anonymous referee for valuable comments and suggestions. This publication makes use of data products from the Two Micron All Sky Survey (2MASS) and Wide-field Infrared Survey Explorer (WISE). The 2MASS is a joint project of the University of Massachusetts and the Infrared Processing and Analysis Centre/California Institute of Technology, funded by the National Aeronautics and Space Administration and the National Science Foundation. WISE is managed and operated by NASA’s Jet Propulsion Laboratory (JPL) in Pasadena, California and is a project of the JPL/California Institute of Technology, funded by the National Aeronautics and Space Administration. The spacecraft scanned the entire sky twice. E. Bica and C. Bonatto acknowledge support from CNPq (Brazil).
References
- Antoja, T., Mateu, C., Aguilar, L., et al. 2015, MNRAS, 453, 541 [NASA ADS] [CrossRef] [Google Scholar]
- Battaglia, G., Fraternali, F., Oosterloo, T., & Sancisi, R. 2006, A&A, 447, 49 [NASA ADS] [CrossRef] [EDP Sciences] [Google Scholar]
- Bechtol, K., Drlica-Wagner, A., Balbinot, E., et al. 2015, ApJ, 807, 50 [NASA ADS] [CrossRef] [Google Scholar]
- Benjamin, R. A., & Danly, L. 1997, ApJ, 481, 764 [NASA ADS] [CrossRef] [Google Scholar]
- Bica, E., Bonatto, C., & Camargo, D. 2008a, MNRAS, 385, 349 [NASA ADS] [CrossRef] [Google Scholar]
- Bica, E., Bonatto, C., & Dutra, C. M. 2008b, A&A, 489, 1129 [NASA ADS] [CrossRef] [EDP Sciences] [Google Scholar]
- Binney, J., Dehnen, W., & Bertelli, G. 2000, MNRAS, 318, 658 [NASA ADS] [CrossRef] [Google Scholar]
- Blitz, L., Magnani, L., & Mundy, L. 1984, ApJ, 282, 9 [Google Scholar]
- Blitz, L., Spergel, D. N., Teuben, P. J., Hartmann, D., & Burton, W. B. 1999, ApJ, 514, 818 [NASA ADS] [CrossRef] [Google Scholar]
- Bonatto, C., & Bica, E. 2007, MNRAS, 377, 1301 [NASA ADS] [CrossRef] [Google Scholar]
- Bonatto, C., & Bica, E. 2008a, A&A, 477, 829 [NASA ADS] [CrossRef] [EDP Sciences] [Google Scholar]
- Bonatto, C., & Bica, E. 2008b, A&A, 485, 81 [NASA ADS] [CrossRef] [EDP Sciences] [Google Scholar]
- Bonatto, C., & Bica, E. 2009, MNRAS, 397, 1915 [NASA ADS] [CrossRef] [Google Scholar]
- Bonatto, C., & Bica, E. 2010, A&A, 516, A81 [NASA ADS] [CrossRef] [EDP Sciences] [Google Scholar]
- Bonatto, C., & Bica, E. 2011, A&A, 530, A32 [NASA ADS] [CrossRef] [EDP Sciences] [Google Scholar]
- Bregman, J. N. 1980, ApJ, 236, 577 [NASA ADS] [CrossRef] [Google Scholar]
- Bressan, A., Marigo, P., Girardi, L., et al. 2012, MNRAS, 427, 127 [NASA ADS] [CrossRef] [Google Scholar]
- Camargo, D., Bonatto, C., & Bica, E. 2009, A&A, 508, 211 [NASA ADS] [CrossRef] [EDP Sciences] [Google Scholar]
- Camargo, D., Bonatto, C., & Bica, E. 2010, A&A, 521, A42 [NASA ADS] [CrossRef] [EDP Sciences] [Google Scholar]
- Camargo, D., Bonatto, C., & Bica, E. 2011, MNRAS, 416, 1522 [NASA ADS] [CrossRef] [Google Scholar]
- Camargo, D., Bonatto, C., & Bica, E. 2012, MNRAS, 423, 1940 [NASA ADS] [CrossRef] [Google Scholar]
- Camargo, D., Bica, E., & Bonatto, C. 2013, MNRAS, 432, 3349 [NASA ADS] [CrossRef] [Google Scholar]
- Camargo, D., Bica, E., Bonatto, C., & Salerno, G. 2015a, MNRAS, 448, 1930 [NASA ADS] [CrossRef] [Google Scholar]
- Camargo, D., Bica, E., & Bonatto, C. 2015b, New Astron., 34, 84 [NASA ADS] [CrossRef] [Google Scholar]
- Camargo, D., Bonatto, C., & Bica, E. 2015c, MNRAS, 450, 4150 [NASA ADS] [CrossRef] [Google Scholar]
- Camargo, D., Bica, E., & Bonatto, C. 2016, MNRAS, 455, 3126 [NASA ADS] [CrossRef] [Google Scholar]
- Chiappini, C., Matteucci, F., & Romano, D. 2001, ApJ, 554, 1044 [NASA ADS] [CrossRef] [Google Scholar]
- Christodoulou, D. M., Tohline, J. E., & Keenan, F. P. 1997, ApJ, 486, 810 [NASA ADS] [CrossRef] [Google Scholar]
- Cresci, G., Mannucci, F., Maiolino, R., et al. 2010, Nature, 467, 811 [NASA ADS] [CrossRef] [PubMed] [Google Scholar]
- Dickey, J. M., & Lockman, F. J. 1990, ARA&A, 28, 215 [NASA ADS] [CrossRef] [MathSciNet] [Google Scholar]
- Drlica-Wagner, A., Bechtol, K., Rykoff, E. S., et al. 2015, ApJ, 813, 109 [NASA ADS] [CrossRef] [Google Scholar]
- Fernández, X., Joung, M. R., & Putman, M. E. 2012, ApJ, 749, 181 [NASA ADS] [CrossRef] [Google Scholar]
- Fraternali, F. 2014, in IAU Symp. 298, eds. S. Feltzing, G. Zhao, N. A. Walton, & P. Whitelock, 228 [Google Scholar]
- Fraternali, F., & Tomassetti, M. 2012, MNRAS, 426, 2166 [NASA ADS] [CrossRef] [Google Scholar]
- Fraternali, F., Oosterloo, T., Sancisi, R., & van Moorsel, G. 2001, ApJ, 562, L47 [NASA ADS] [CrossRef] [Google Scholar]
- Hammer, F., Yang, Y. B., Flores, H., Puech, M., & Fouquet, S. 2015, ApJ, 813, 110 [NASA ADS] [CrossRef] [Google Scholar]
- Heald, G. H., Rand, R. J., Benjamin, R. A., & Bershady, M. A. 2007, ApJ, 663, 933 [NASA ADS] [CrossRef] [Google Scholar]
- Heiles, C., Reach, W. T., & Koo, B. C. 1988, ApJ, 332, 313 [NASA ADS] [CrossRef] [Google Scholar]
- Heitsch, F., & Putman, M. E. 2009, ApJ, 698, 1485 [NASA ADS] [CrossRef] [Google Scholar]
- Hernandez, A. K., Wakker, B. P., Benjamin, R. A., et al. 2013, ApJ, 777, 19 [NASA ADS] [CrossRef] [Google Scholar]
- Huxor, A. P., & Grebel, E. K. 2015, MNRAS, 453, 2653 [NASA ADS] [CrossRef] [Google Scholar]
- Joung, M. R., Bryan, G. L., & Putman, M. E. 2012, ApJ, 745, 148 [NASA ADS] [CrossRef] [Google Scholar]
- Kaufmann, T., Mayer, L., Wadsley, J., Stadel, J., & Moore, B. 2006, MNRAS, 370, 1612 [NASA ADS] [CrossRef] [Google Scholar]
- Kaufmann, G., Li, C., & Heckman, T. 2010, MNRAS, 409, 491 [NASA ADS] [CrossRef] [Google Scholar]
- Kerés, D., Katz, N., Weinberg, D. H., & Dave, R. 2005, MNRAS, 363, 2 [NASA ADS] [CrossRef] [Google Scholar]
- King, I. 1962, AJ, 67, 471 [NASA ADS] [CrossRef] [Google Scholar]
- Koposov, S. E., Belokurov, V., Torrealba, G., & Evans, N. W. 2015, ApJ, 805, 130 [NASA ADS] [CrossRef] [Google Scholar]
- Kuntz, K. D., & Danly, L. 1996, ApJ, 457, 703 [NASA ADS] [CrossRef] [Google Scholar]
- Lada, C. J., & Lada, E. A. 2003, ARA&A, 41, 57 [NASA ADS] [CrossRef] [Google Scholar]
- Lee, H.-T., & Chen, W. P. 2009, ApJ, 694, 1423 [NASA ADS] [CrossRef] [Google Scholar]
- Luque, E., Queiroz, A., Santiago, B., et al. 2016, MNRAS, 458, 603 [NASA ADS] [CrossRef] [Google Scholar]
- Magnani, L., Hartmann, D., & Speck, B. G. 1996, ApJS, 106, 447 [NASA ADS] [CrossRef] [Google Scholar]
- Majaess, D. 2013, Ap&SS, 344, 175 [NASA ADS] [CrossRef] [Google Scholar]
- Maller, A. H., & Bullock, J. S. 2004, MNRAS, 355, 694 [NASA ADS] [CrossRef] [Google Scholar]
- Martin, P. G., Blagrave, K. P. M., Lockman, F. J., et al. 2015, ApJ, 809, 153 [NASA ADS] [CrossRef] [Google Scholar]
- Melioli, C., Brighenti, F., D’Ercole, A., & de Gouveia Dal Pino, E. M. 2008, MNRAS, 388, 573 [NASA ADS] [CrossRef] [Google Scholar]
- Melioli, C., Brighenti, F., D’Ercole, A., & de Gouveia Dal Pino, E. M. 2009, MNRAS, 399, 1089 [NASA ADS] [CrossRef] [Google Scholar]
- Muller, C. A., Oort, J. H., & Raimond, E. 1963, C. R. Acad. Sci. Paris, 257, 1661 [Google Scholar]
- Nichols, M., & Bland-Hawthorn, J. 2009, ApJ, 707, 1642 [NASA ADS] [CrossRef] [Google Scholar]
- Oort, J. H. 1966, Bull. Astron. Inst. Neth., 18, 421 [NASA ADS] [Google Scholar]
- Oosterloo, T., Fraternali, F., & Sancisi, R. 2007, AJ, 134, 1019 [NASA ADS] [CrossRef] [Google Scholar]
- Perryman, M. A. C., de Boer, K. S., Gilmore, G., et al. 2001, A&A, 369, 339 [NASA ADS] [CrossRef] [EDP Sciences] [Google Scholar]
- Pidopryhora, Y., Lockman, F. J., & Shields, J. C. 2007, ApJ, 656, 928 [NASA ADS] [CrossRef] [Google Scholar]
- Plöckinger, S., & Hensler, G. 2012, A&A, 547, A43 [NASA ADS] [CrossRef] [EDP Sciences] [Google Scholar]
- Putman, M. E., Thom, C., Gibson, B. K., & Staveley-Smith, L. 2004, ApJ, 603, 77 [NASA ADS] [CrossRef] [Google Scholar]
- Putman, M. E., Peek, J. E. G., & Joung, M. R. 2012, ARA&A, 50, 491 [NASA ADS] [CrossRef] [Google Scholar]
- Quilis, V., & Moore, B. 2001, ApJ, 555, 95 [Google Scholar]
- Sancisi, R., Fraternali, F., Oosterloo, T., & van der Hulst, T. 2008, A&ARv, 15, 189 [NASA ADS] [CrossRef] [EDP Sciences] [Google Scholar]
- Schlafly, E. F., Green, G., Finkbeiner, D. P., et al. 2015, ApJ, 799, 1165 [NASA ADS] [CrossRef] [Google Scholar]
- Shapiro, P. R., & Field, G. B. 1976, ApJ, 205, 762 [NASA ADS] [CrossRef] [Google Scholar]
- Smith, G. P. 1963, Bull. Astron. Inst. Neth., 17, 203 [Google Scholar]
- Spitoni, E., Matteucci, F., Recchi, S., Cescutti, G., & Pipino, A. 2009, A&A, 504, 87 [NASA ADS] [CrossRef] [EDP Sciences] [Google Scholar]
- Tepper-Garcia, T., Bland-Hawthorn, J., & Sutherland, R. S. 2015, ApJ, 813, 94 [NASA ADS] [CrossRef] [Google Scholar]
- Thilker, D. A., Braun, R., Walterbos, R. A. M., et al. 2004, ApJ, 601, 39 [Google Scholar]
- Tutukov, A. V. 1978, A&A, 70, 57 [NASA ADS] [Google Scholar]
- Wolfe, S. A., Lockman, F. J., & Pisano, D. J. 2016, ApJ, 816, 81 [NASA ADS] [CrossRef] [Google Scholar]
- Wright, E. L., Eisenhardt, P. R. M., Mainzer, A. K., et al. 2010, AJ, 140, 1868 [NASA ADS] [CrossRef] [Google Scholar]
All Tables
All Figures
|
Fig. 1 WISE (15′ × 15′) multicolour images centred on the central coordinates of the embedded clusters C 1074, C 939, C 1099, and C 934. North is to the top and east to the left. Circles encompass more probable cluster stars (Sect. 2). |
| In the text | |
|
Fig. 2 WISE multicolour and W1 images (7′ × 7′) centred on C 1100. C 1100 shows a dust emission shell. North is to the top and east to the left. |
| In the text | |
|
Fig. 3 WISE multicolour image (15′ × 15′) centred on C 932. C 932 is deeply embedded. North is to the top and east to the left. |
| In the text | |
|
Fig. 4 WISE (15′ × 15′) multicolour images centred on the central coordinates of the embedded cluster C 1101. North is to the top and east to the left. |
| In the text | |
|
Fig. 5 C 1074: example of decontamination procedure. Top panels: 2MASS observed CMDs. Middle panels: equal area comparison field. Bottom panels: field-star decontaminated CMDs fitted with PARSEC isochrones for MS and PMS stars. We also show the reddening vector for Av = 1 to 5. |
| In the text | |
|
Fig. 6 Decontaminated CMDs fitted by PARSEC isochrones, for the newly found embedded cluster C 1099 (top panels), C 1100 (middle panels), and C 1101 (bottom panels). We also show the reddening vector for AV = 1 to 5. |
| In the text | |
|
Fig. 7 Decontaminated CMDs for the high-latitude embedded cluster C 932 (top panels), C 934 (middle panels), and C 939 (bottom panels). The colour–magnitude filter used to isolate cluster stars is shown as a shaded region in the decontaminated CMD of C 939. We also show the reddening vector for AV = 1 to 5. |
| In the text | |
|
Fig. 8 Radial density profile for the embedded clusters in this study. The brown horizontal shaded region in the RDP of C 939 corresponds to the stellar background level measured in the comparison field and the grey region corresponds to the 1σ King fit uncertainty. |
| In the text | |
|
Fig. 9 IRAS 100 μm image of the cloud complex possibly related to the high-latitude ECs C 932, C 934, and C 939, which are identified by green circles. |
| In the text | |
|
Fig. 10 WISE multicolour image (45′ × 45′) with a zoom in on the cloud complex of Fig. 9 to show the ECs C 932, C 934, and C 939 in more detail. |
| In the text | |
|
Fig. 11 Spatial distribution of the ECs in this study and Paper I (green circles) compared to ECs in our previous works (red circles). Credit: Robert Hurt (NASA/JPL) and Camargo et al. (2015c). |
| In the text | |
Current usage metrics show cumulative count of Article Views (full-text article views including HTML views, PDF and ePub downloads, according to the available data) and Abstracts Views on Vision4Press platform.
Data correspond to usage on the plateform after 2015. The current usage metrics is available 48-96 hours after online publication and is updated daily on week days.
Initial download of the metrics may take a while.