Free Access
Fig. 8
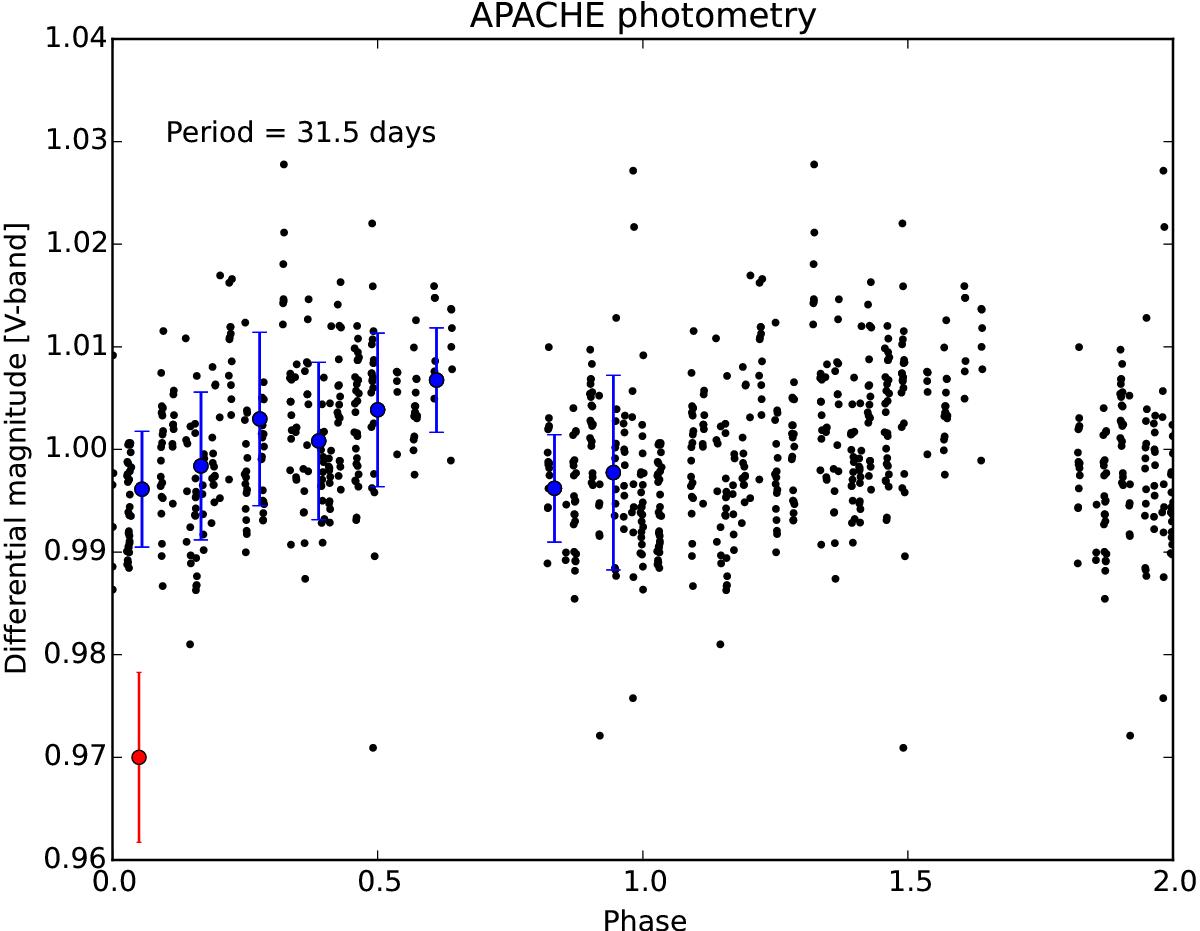
Differential light curve of GJ 3998 observed by APACHE, folded at the best period P = 31.5 days found through a frequency analysis of the time series. The red dot in the lower left corner shows the average uncertainty of the data.
Current usage metrics show cumulative count of Article Views (full-text article views including HTML views, PDF and ePub downloads, according to the available data) and Abstracts Views on Vision4Press platform.
Data correspond to usage on the plateform after 2015. The current usage metrics is available 48-96 hours after online publication and is updated daily on week days.
Initial download of the metrics may take a while.